The IND in figures
Monthly figures March 2024
From February onwards, the IND has further expanded the monthly reporting, with more figures. This concerns figures on residence permits for study, labour migrants and naturalization. In the diagrams below, we provide an explanation when something strikes as remarkable.
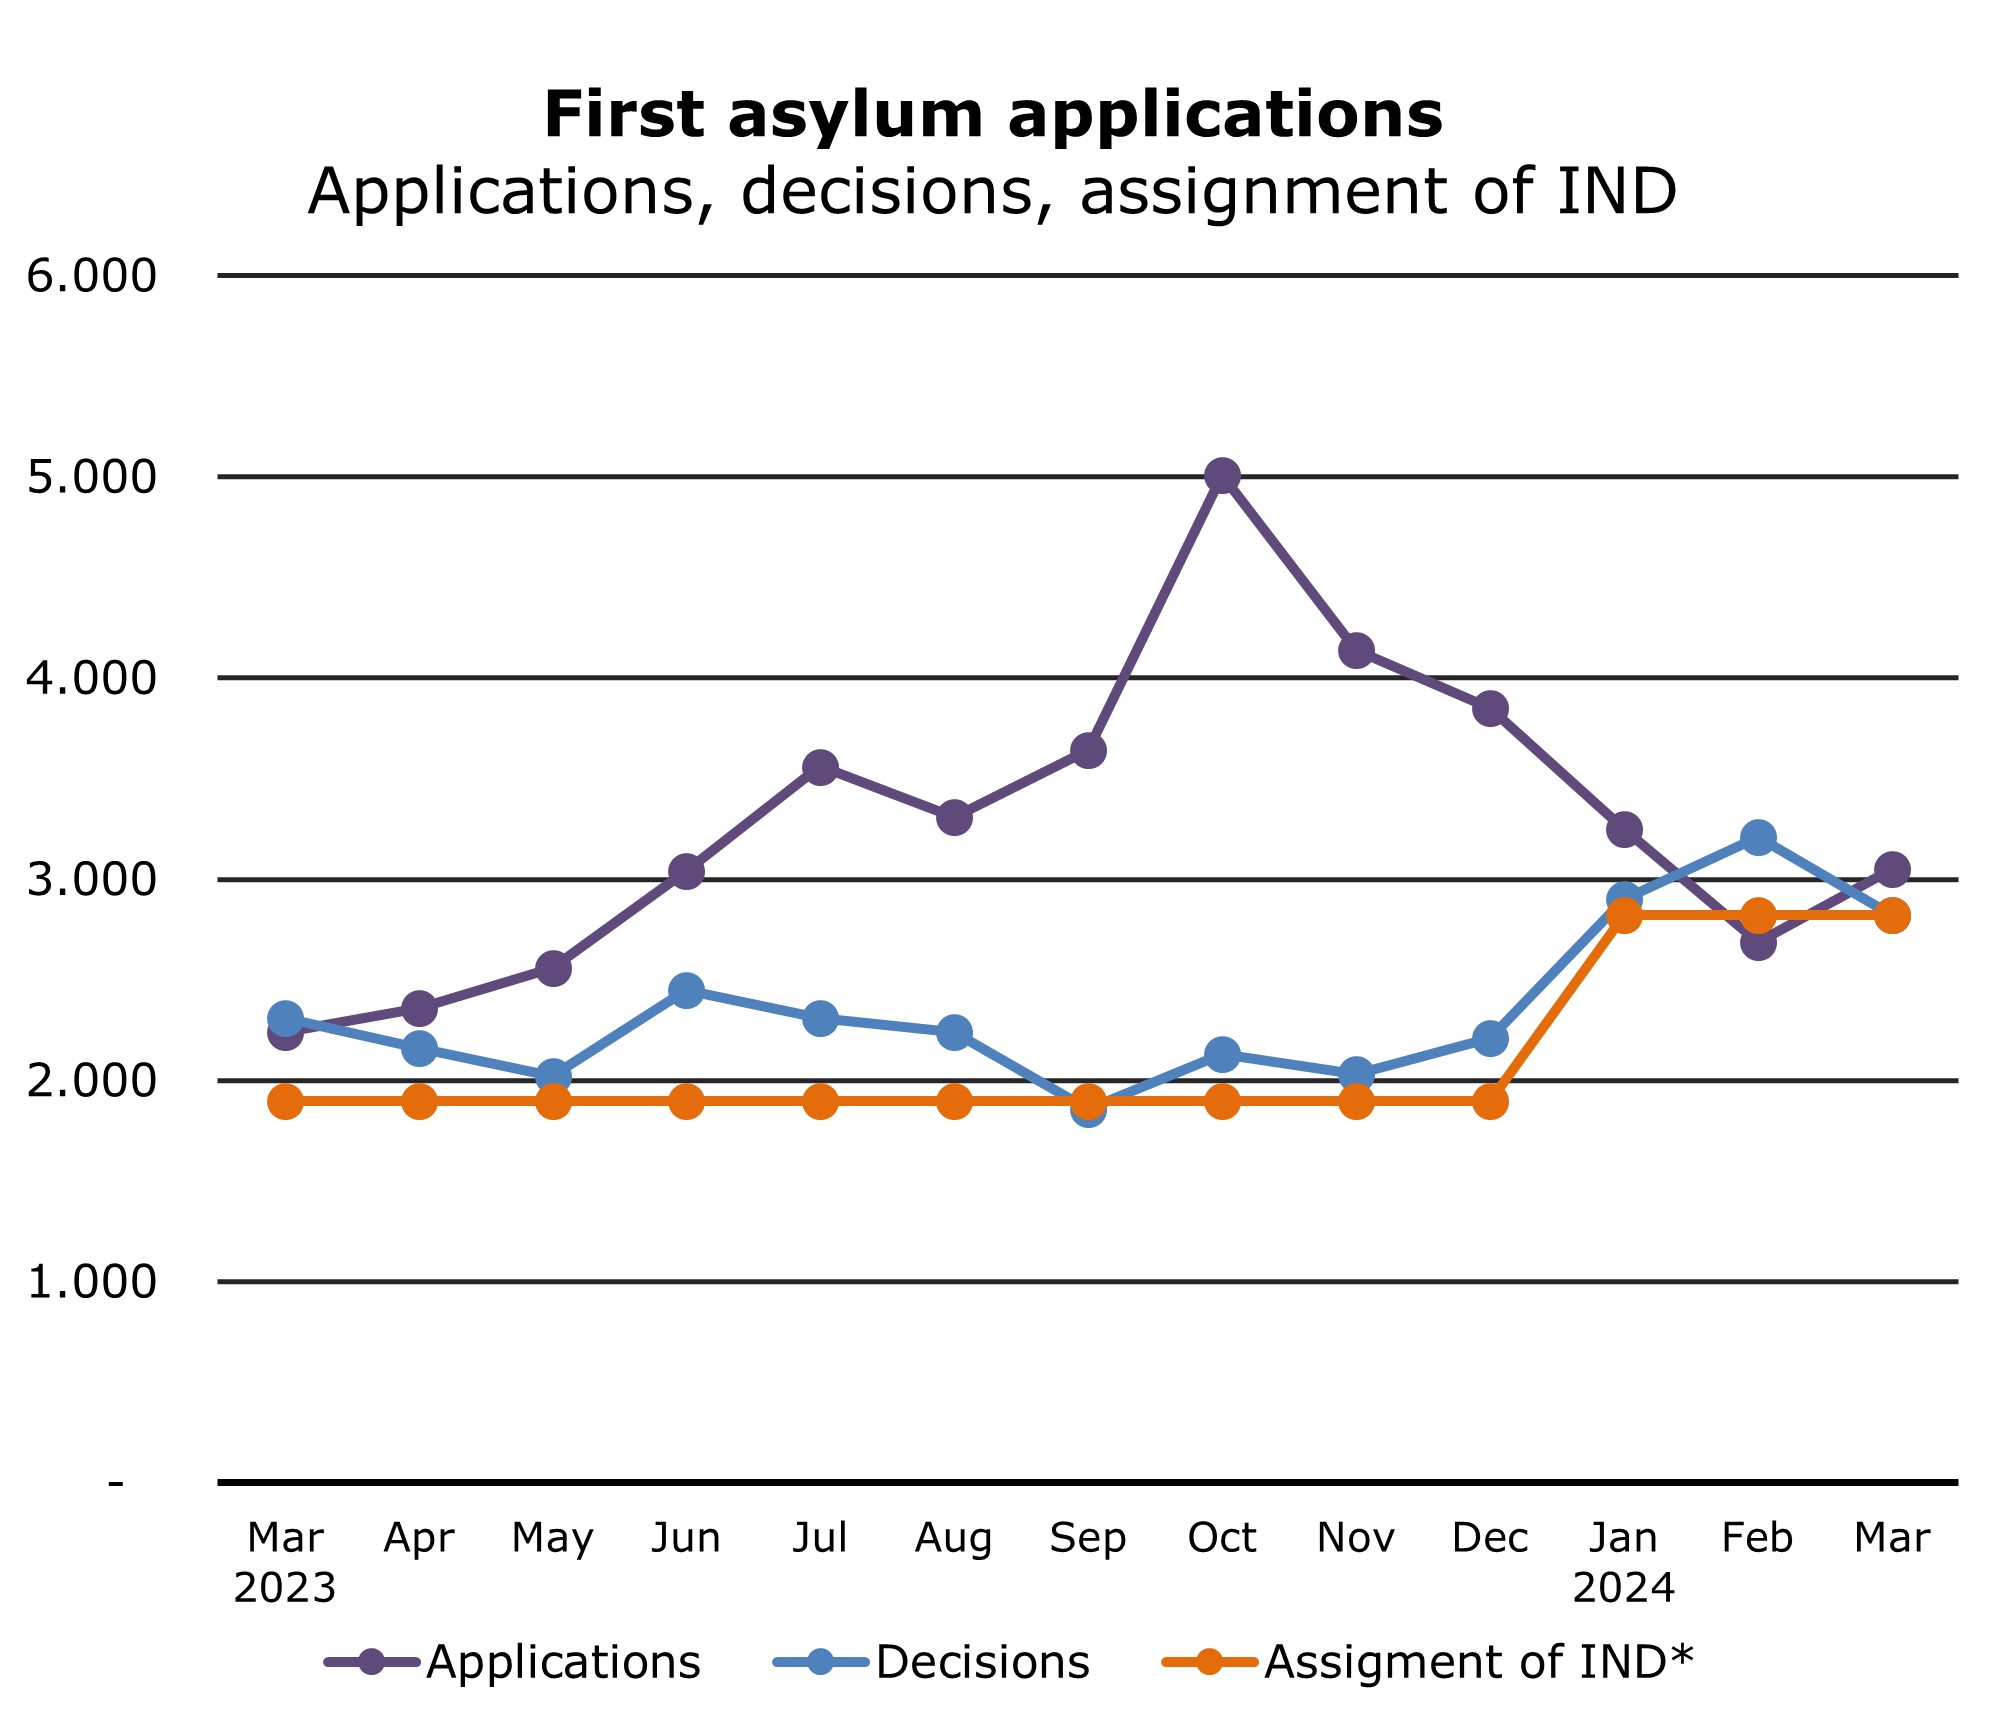
Asylum: First asylum applications
 |
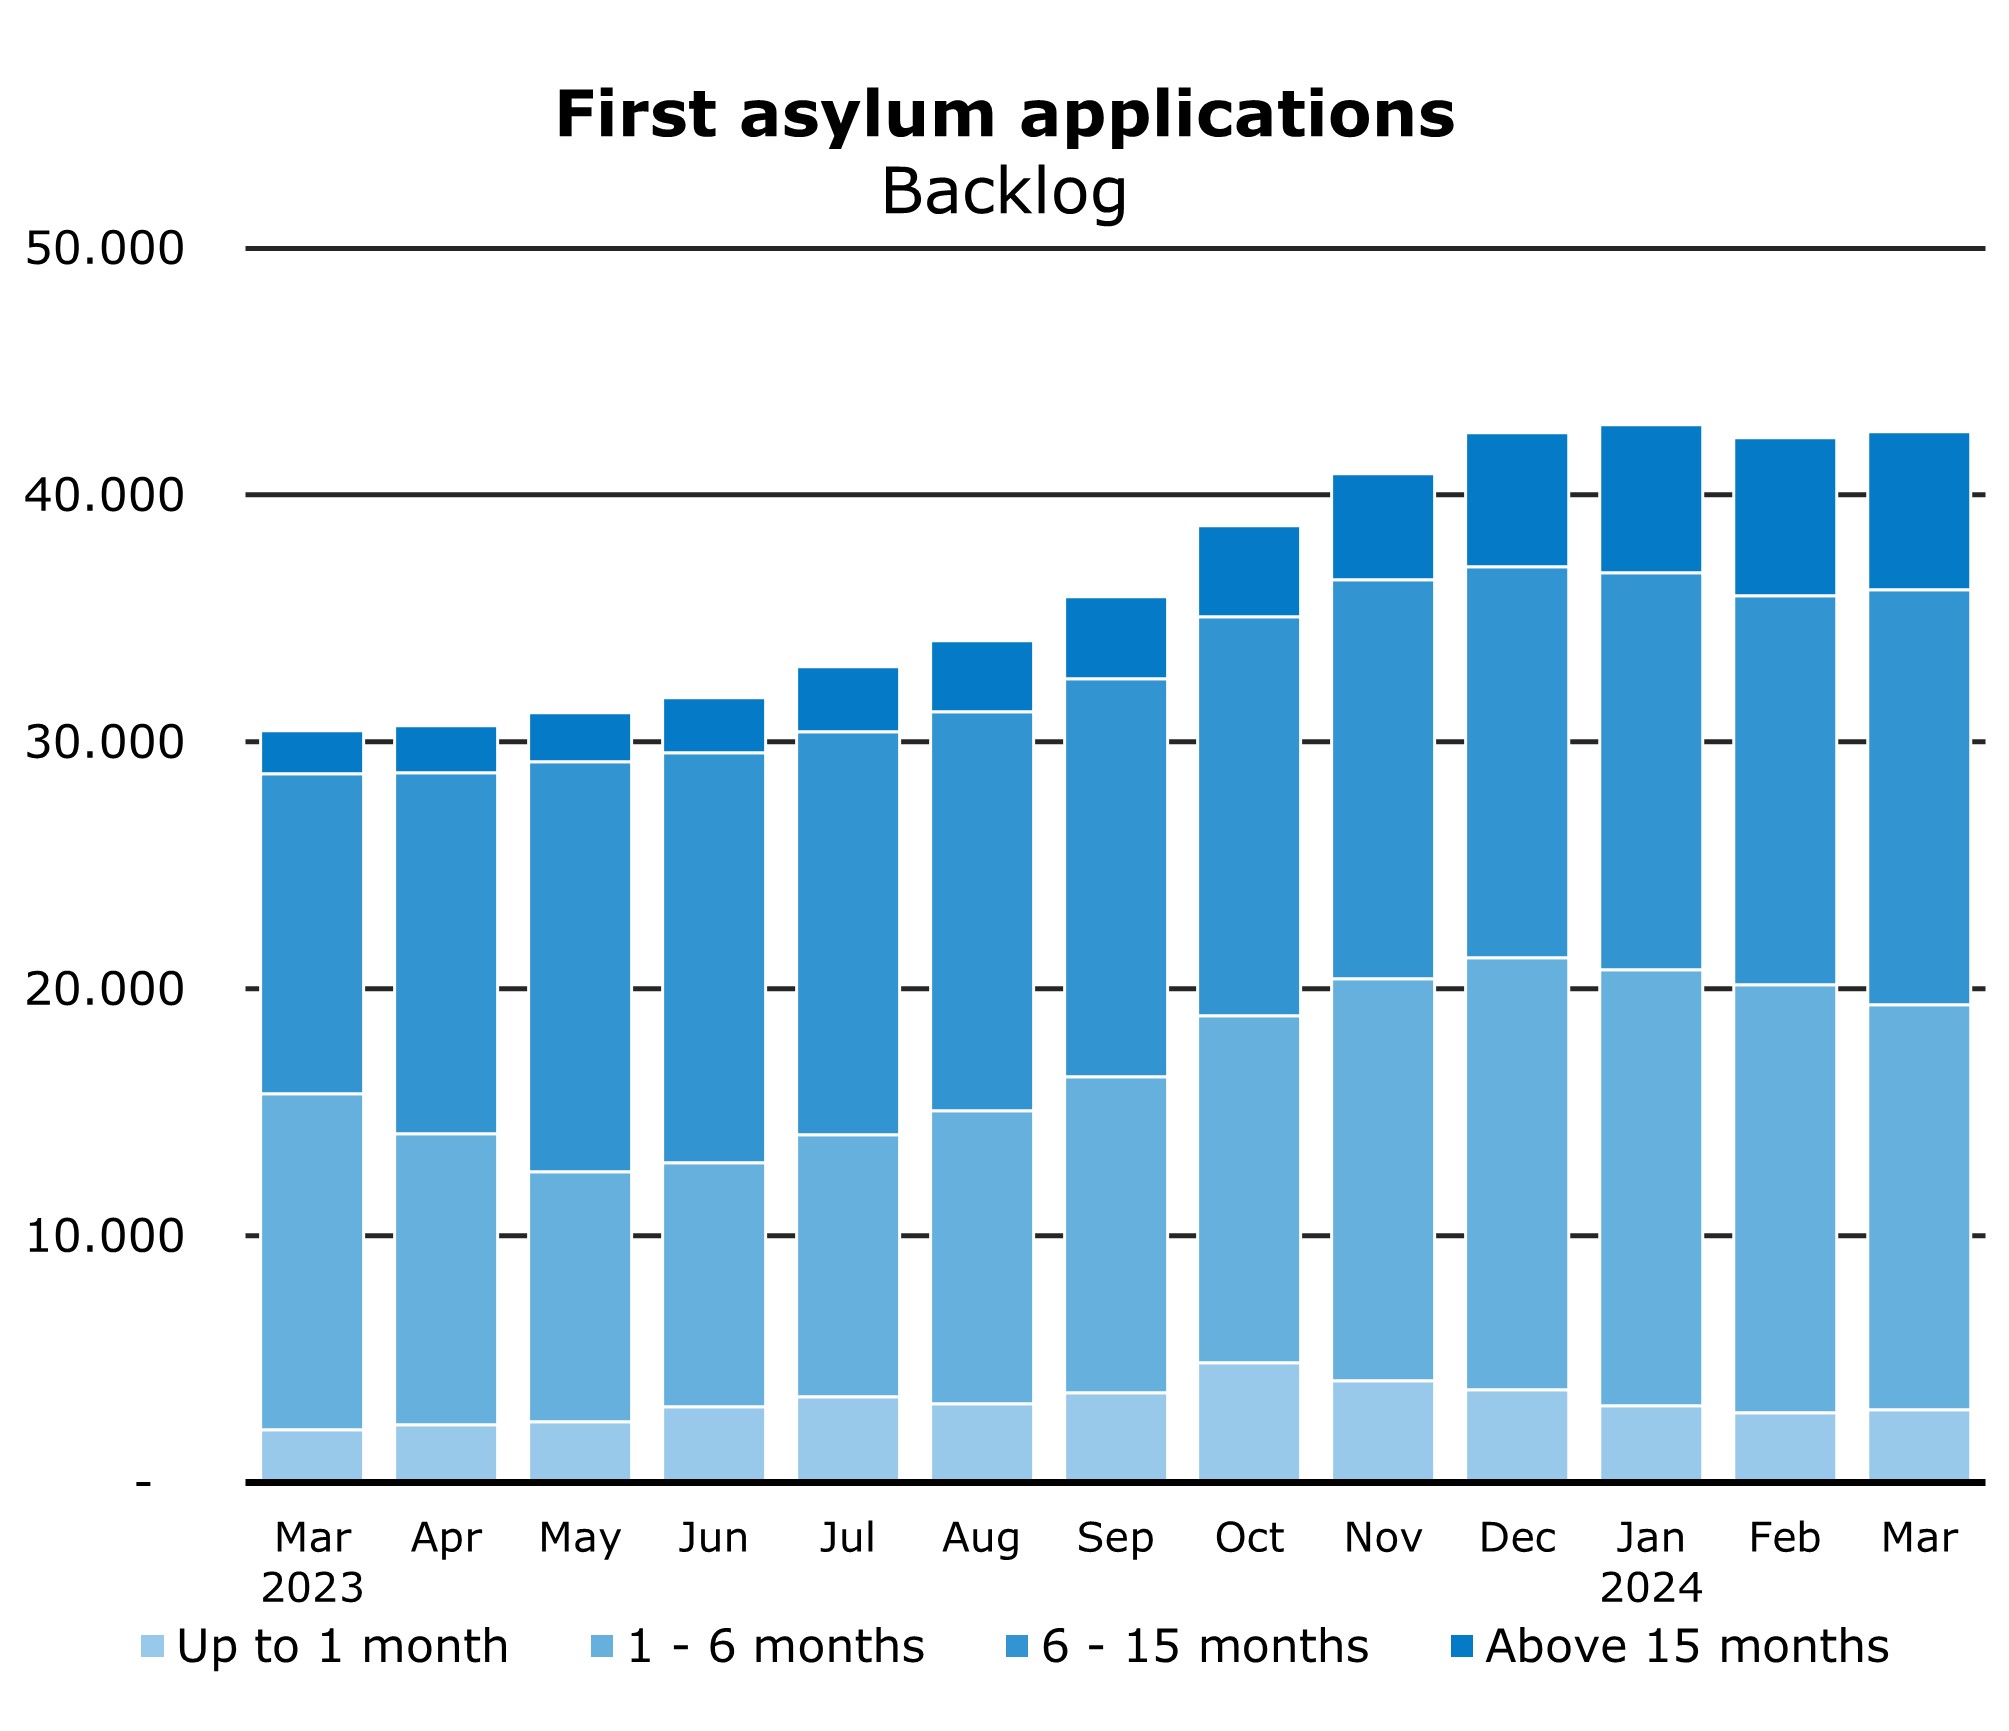 |
In March the IND took 2,820 decisions, just as much as was estimated. The number of first asylum applications increased again in March after a quieter month of February from 2,690 to 3,050. This has caused the number of outstanding applications to rise a bit more.
Explanation of asylum diagrams
The number of applications in the different procedures (track 1, 2, 4) for this month may still change. The numbers in the general asylum procedure usually continue to decline, while applications in the Dublin procedure or in the Safe Country procedure continue to increase. This is due to the moment when an application, among the first asylum applications, is classified into one of the procedures.
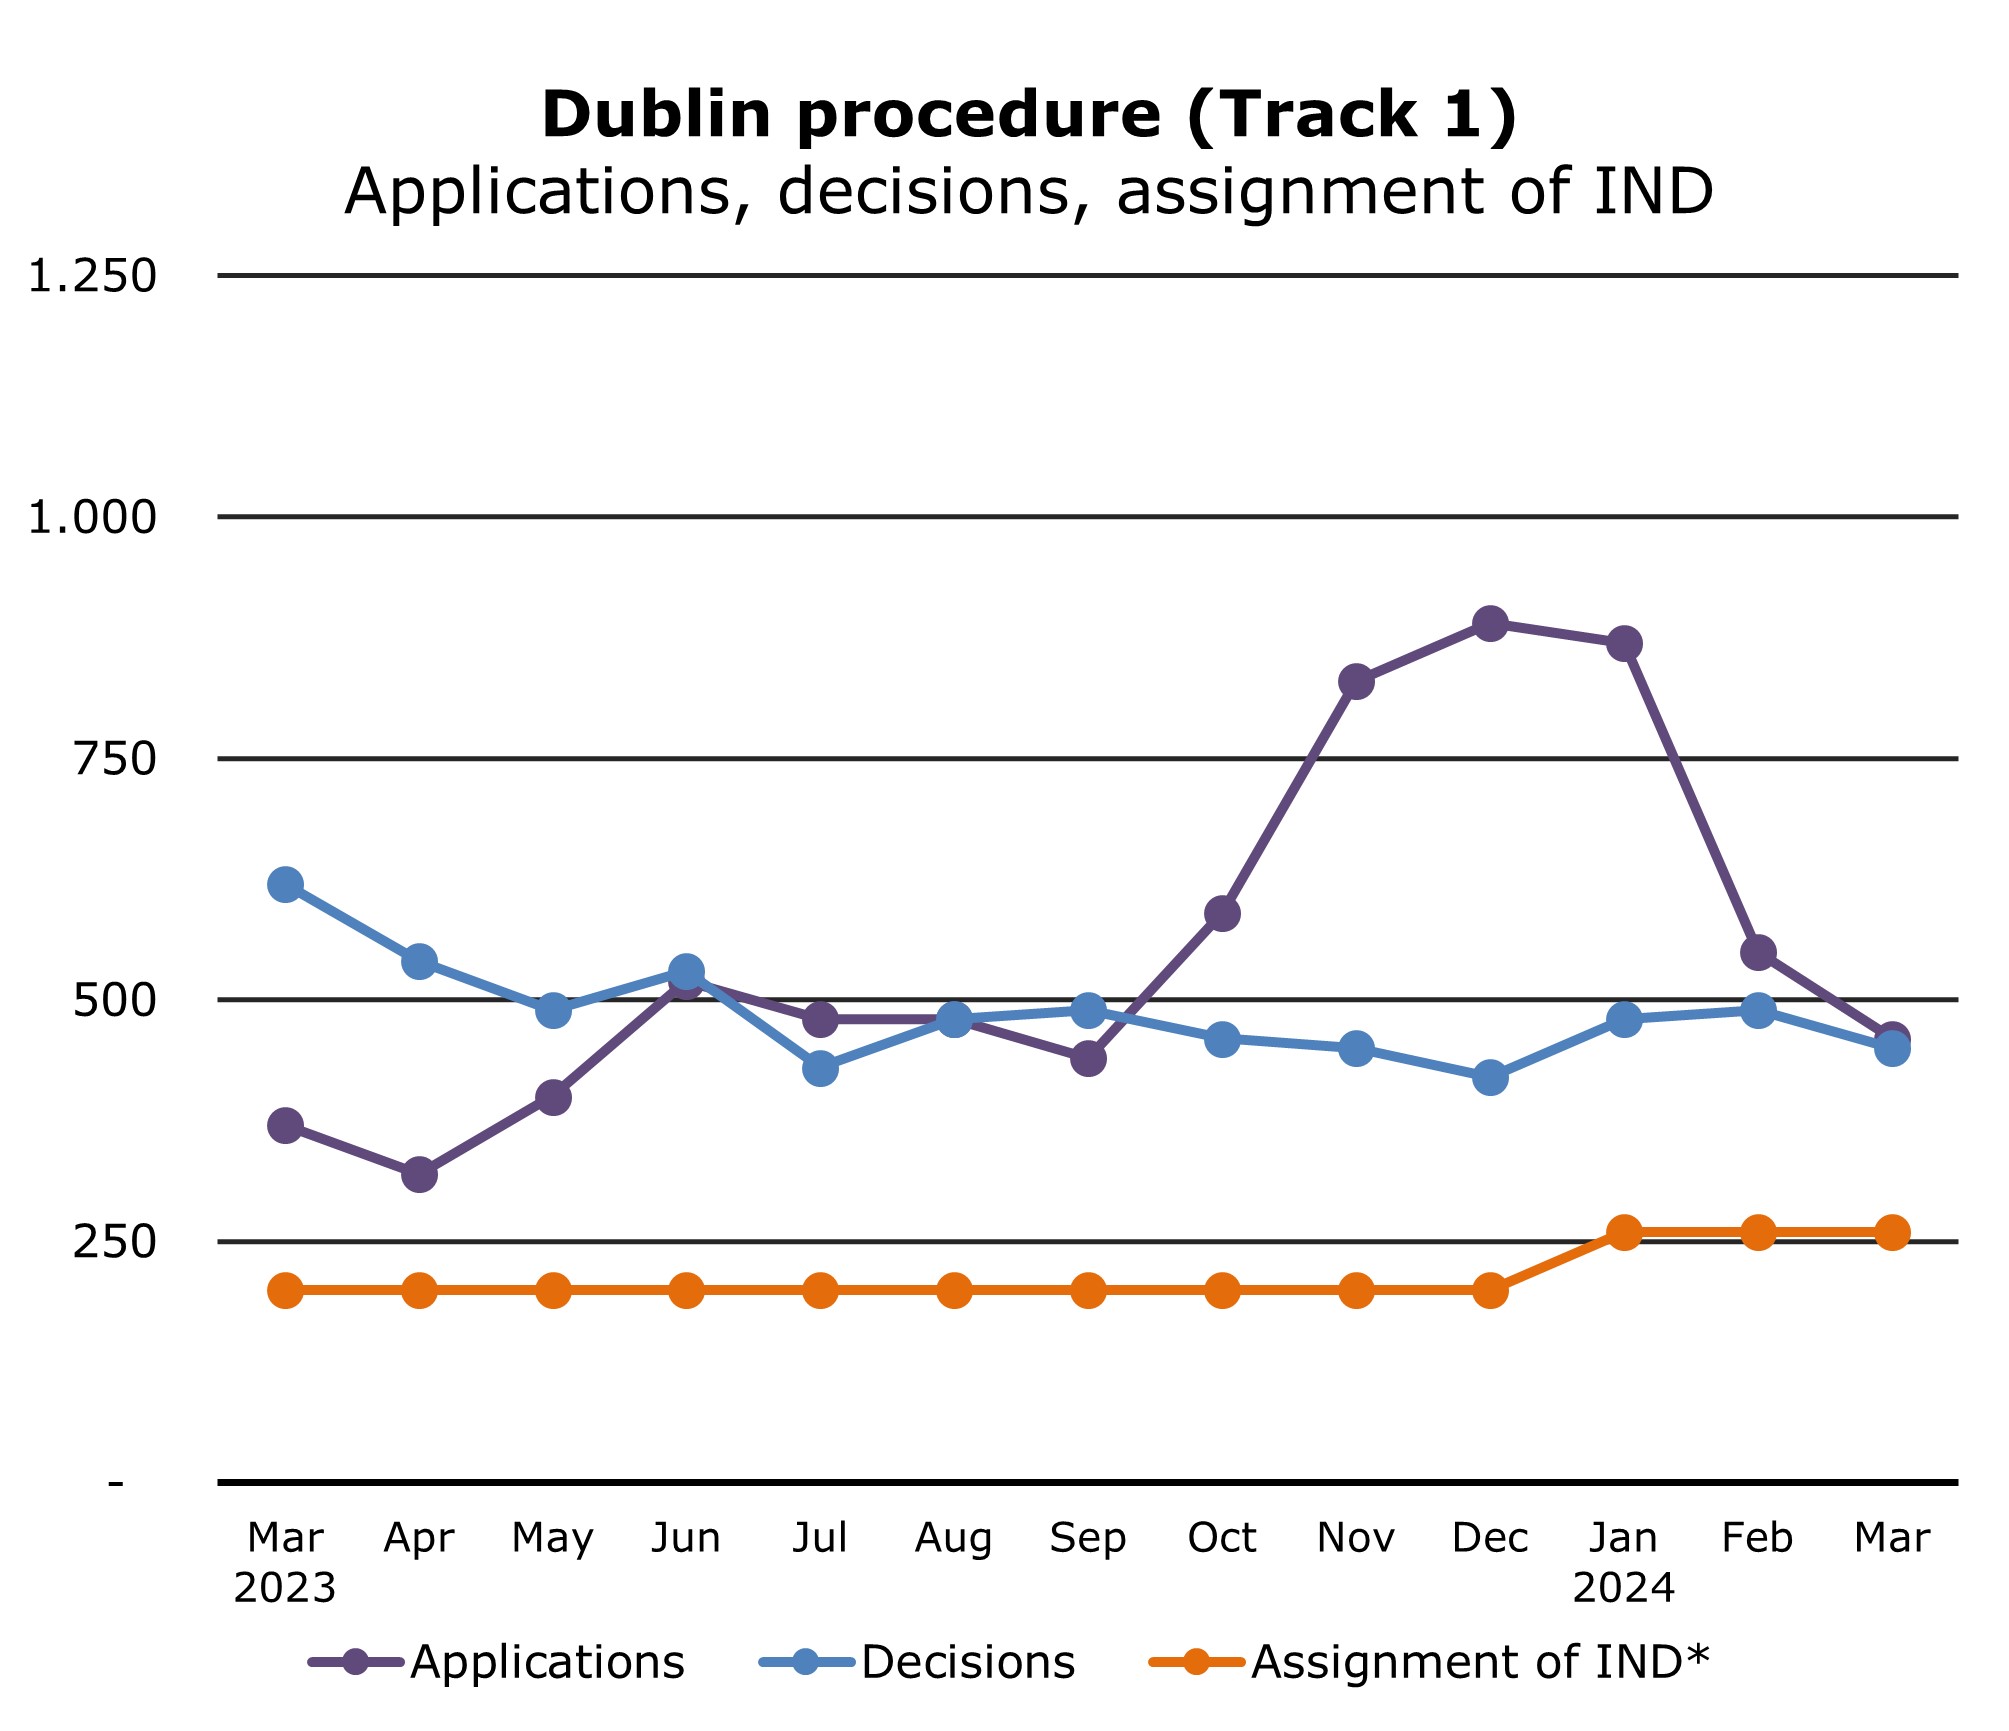
Asylum: Dublin procedure (Track 1)
 |
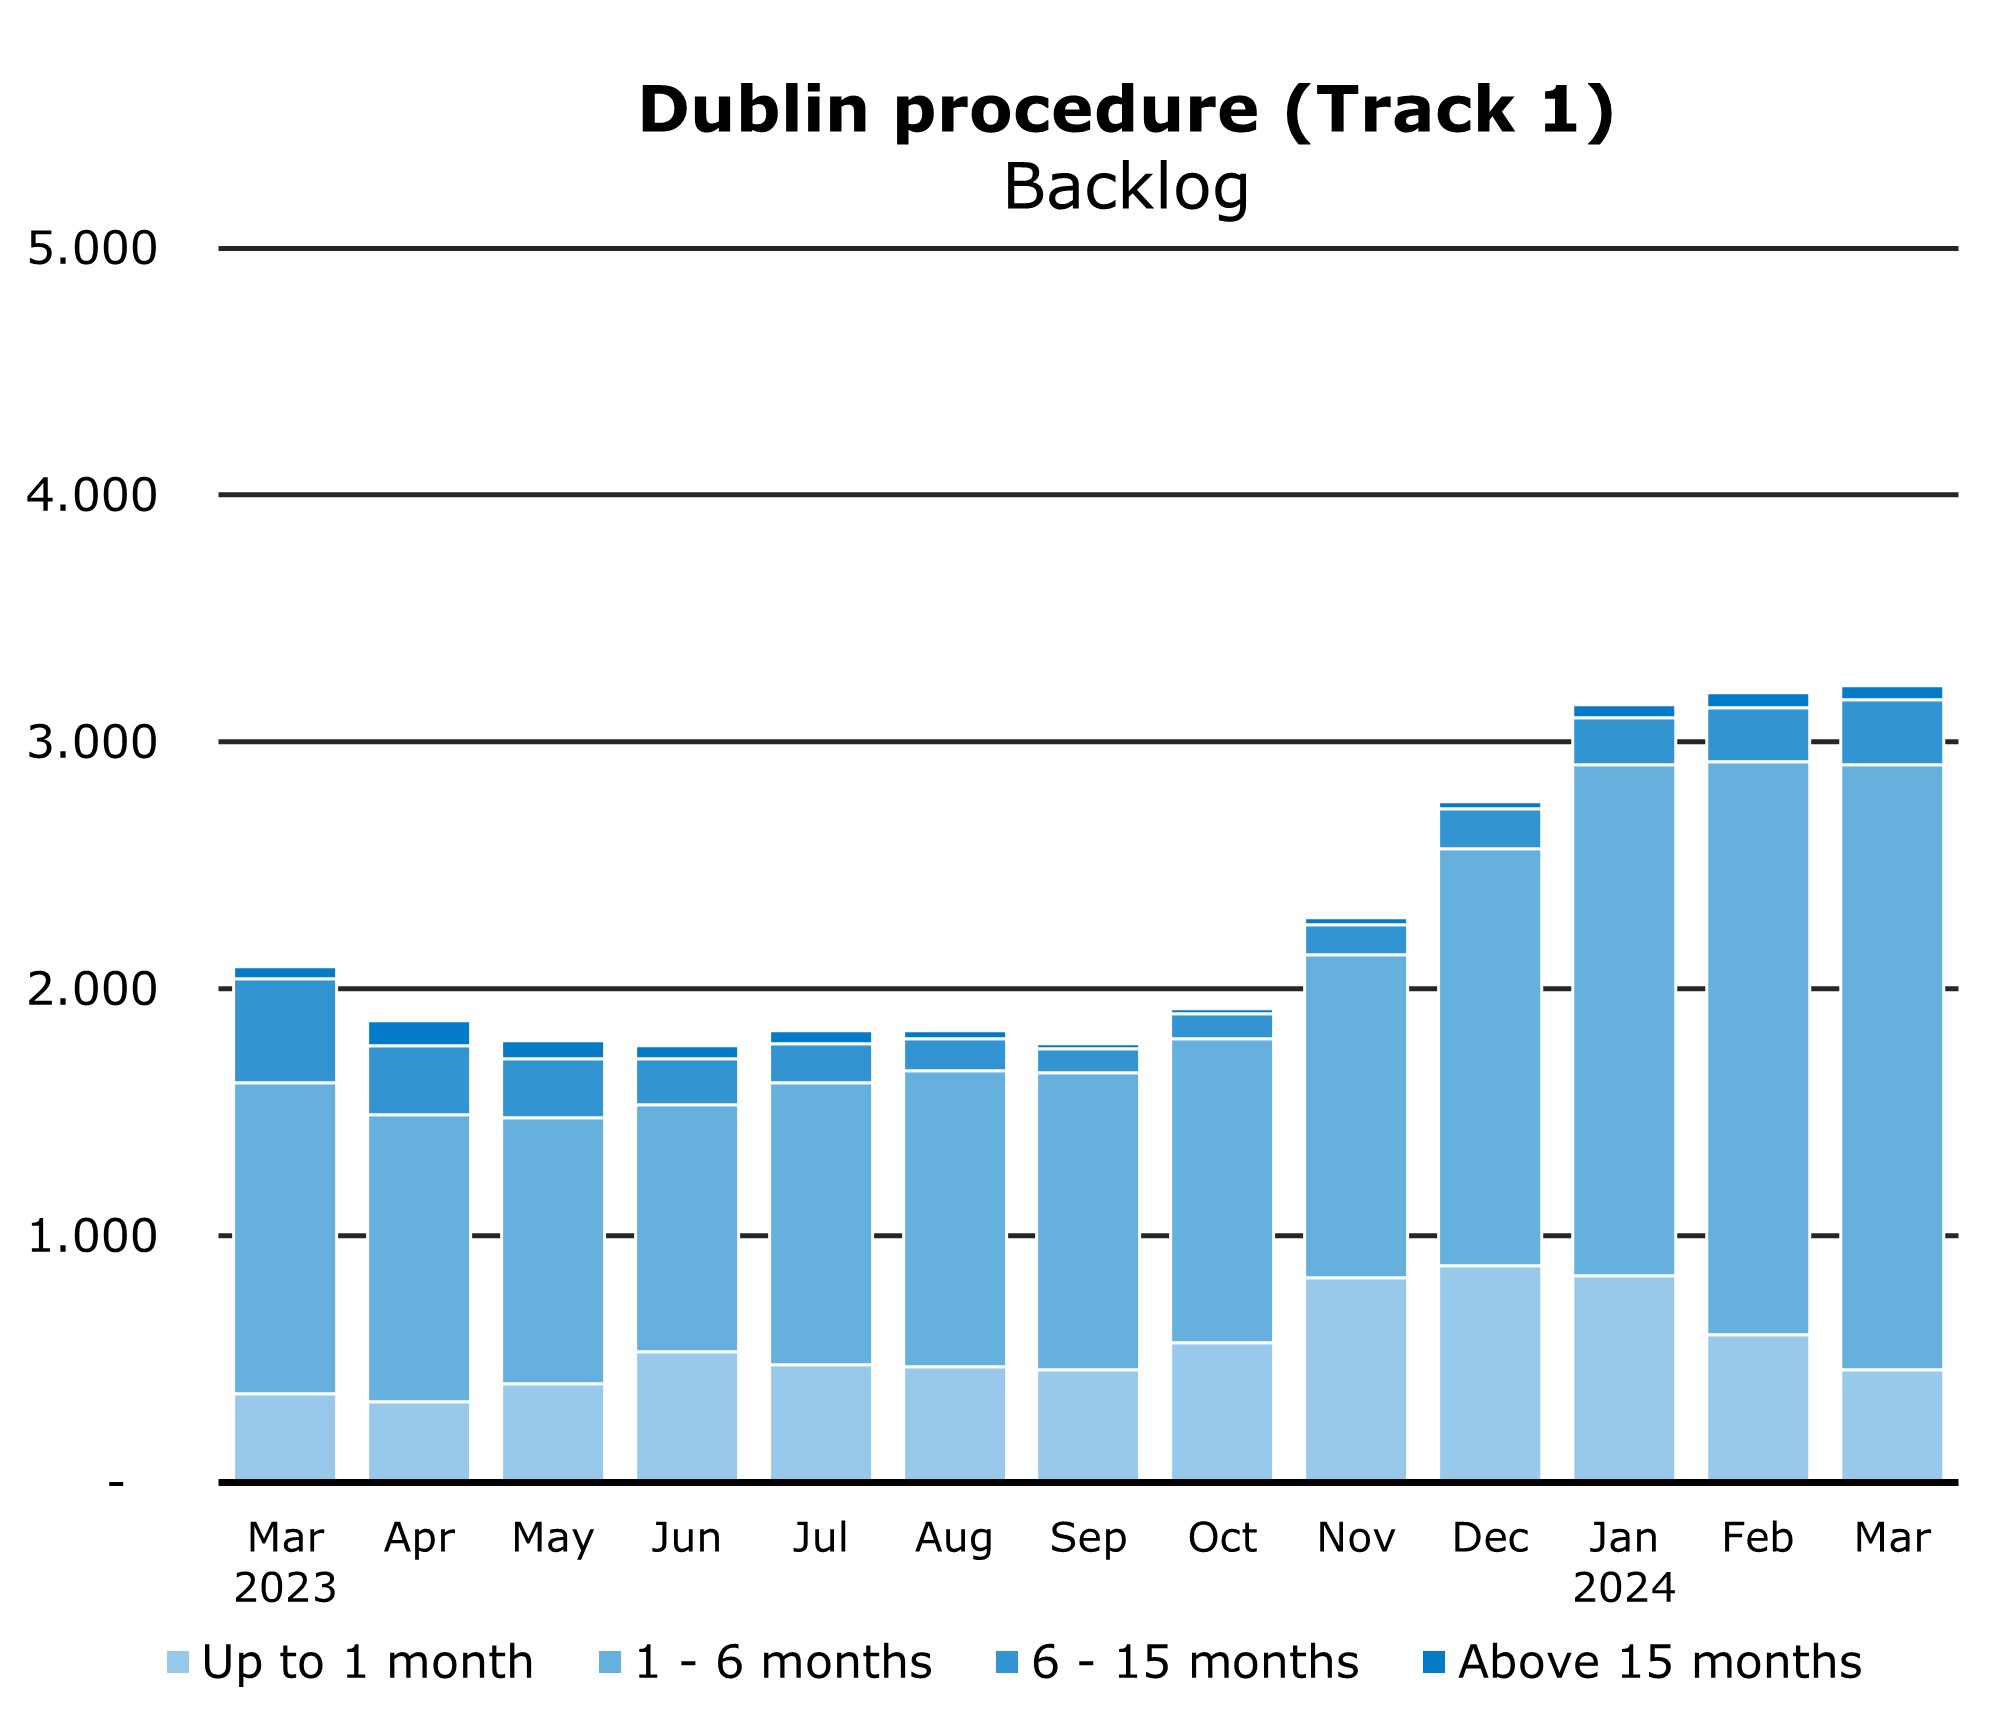 |
In March the IND took 450 decisions in this procedure. These were 190 more than was estimated. Fewer applications were included in this procedure than in the months before. There were 460 in March, whereas this number was still 870 in January.
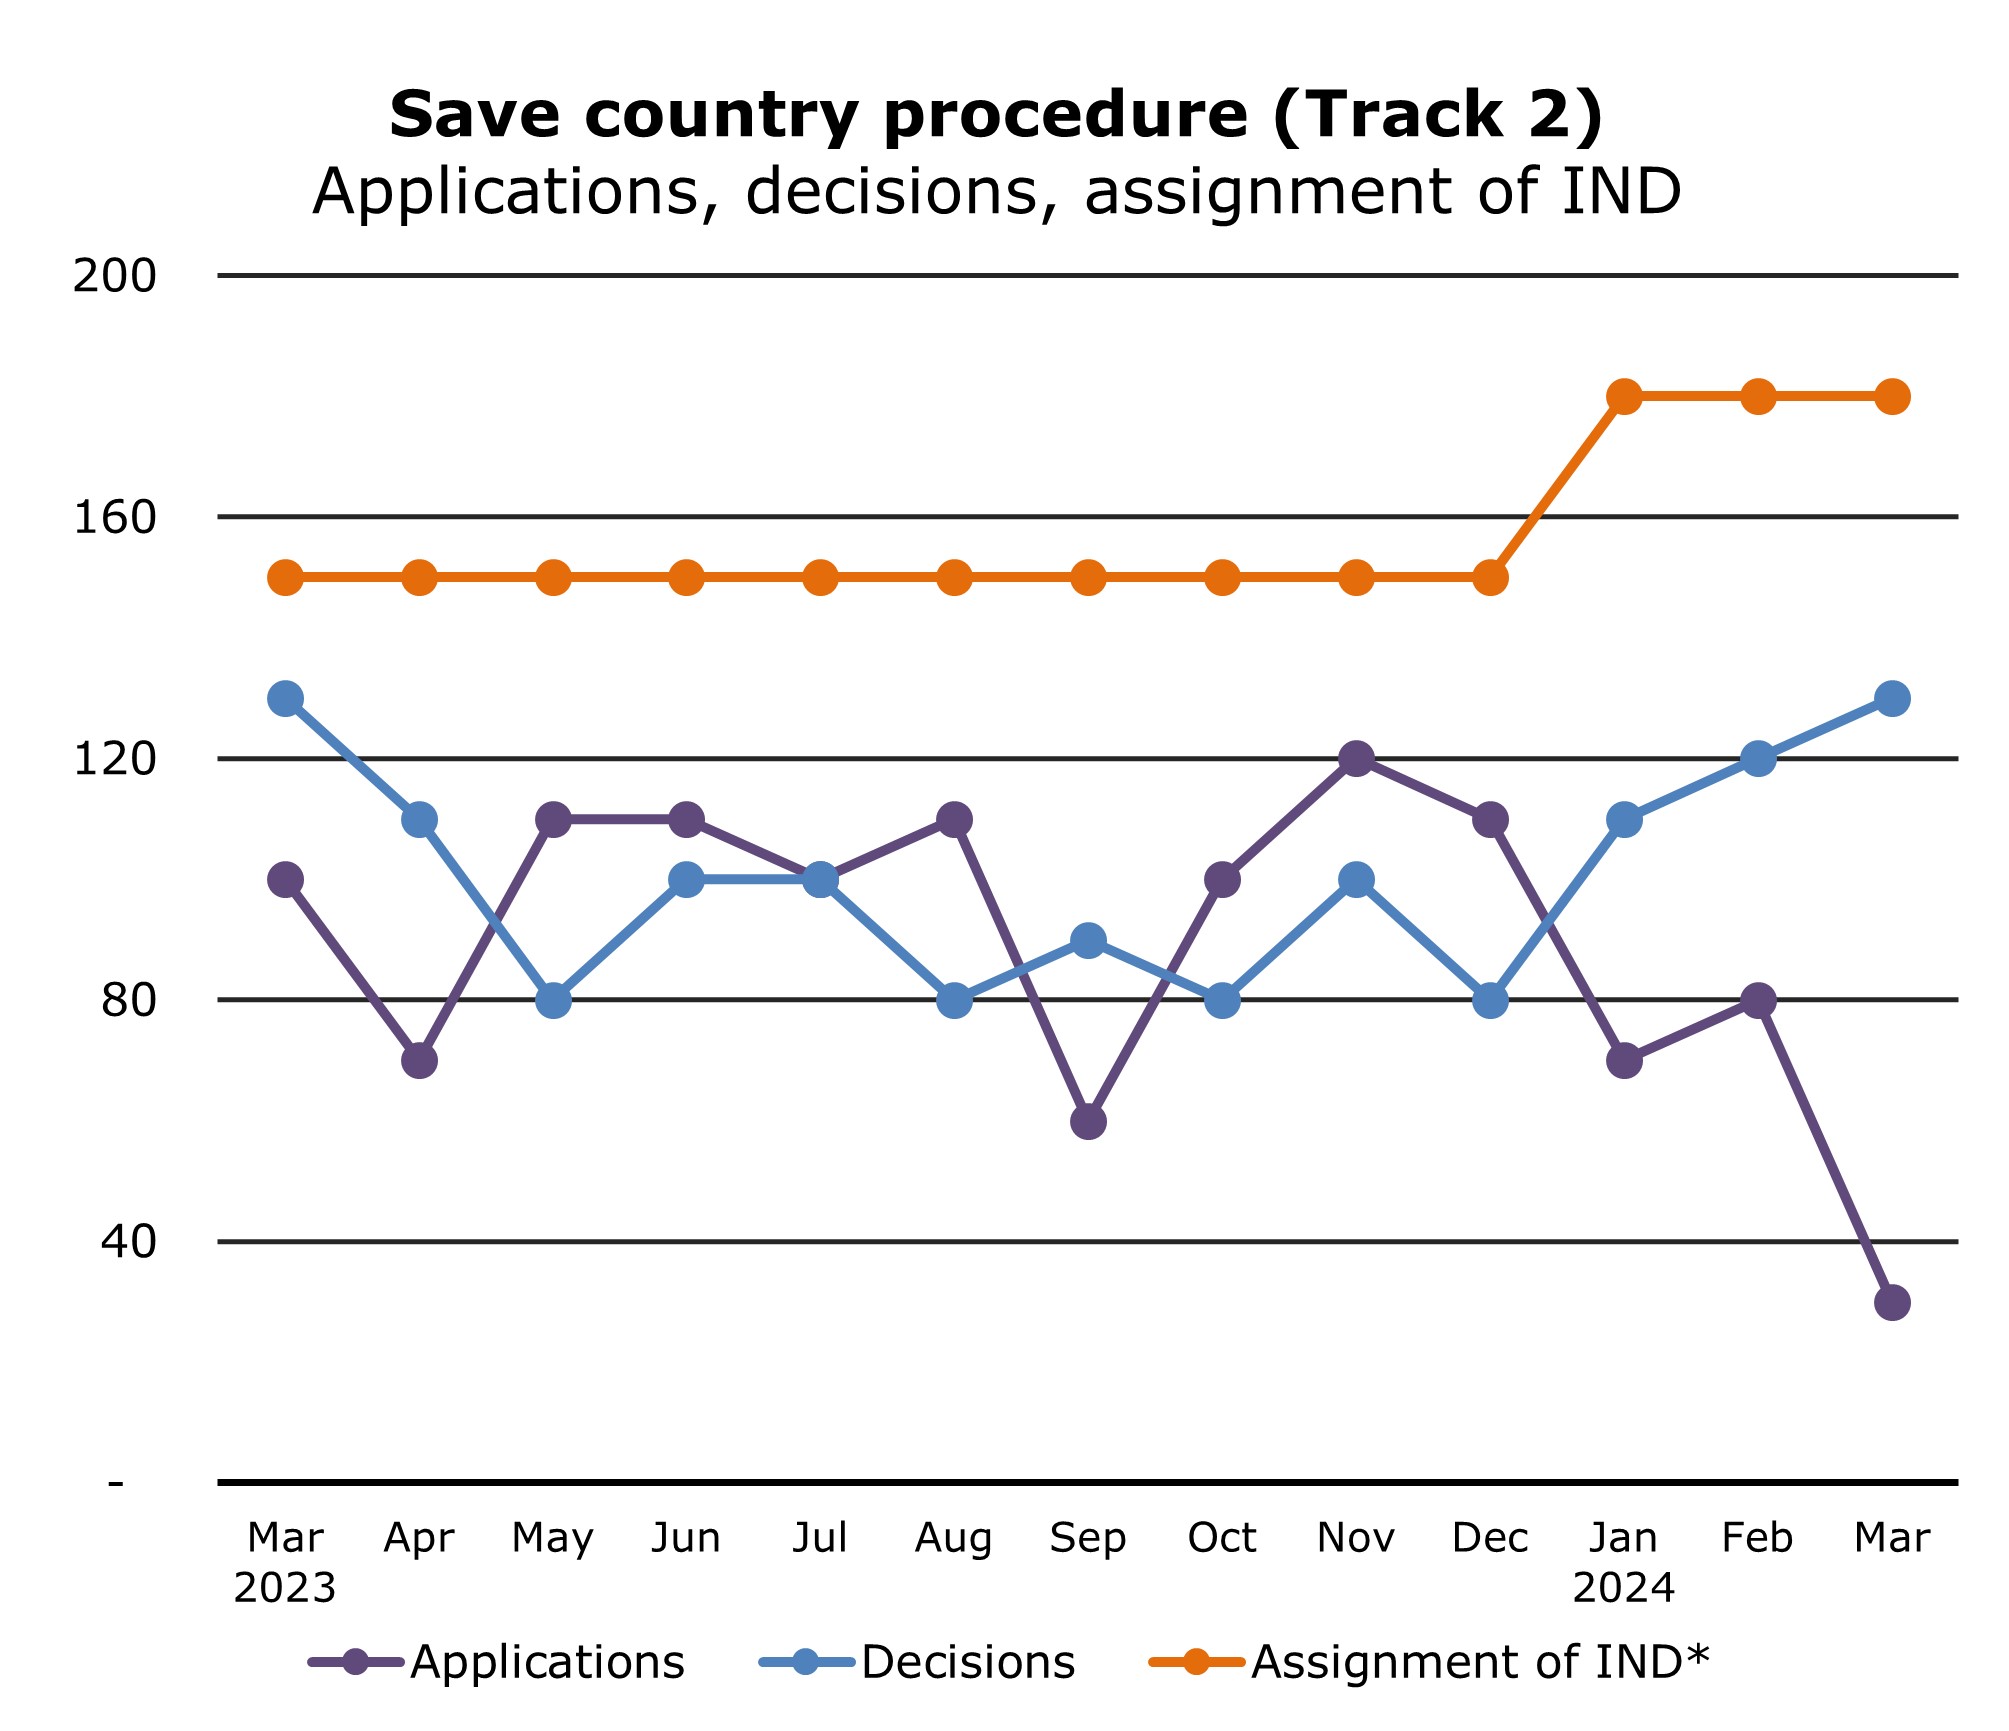
Asylum: Safe Country procedure (track 2)
 |
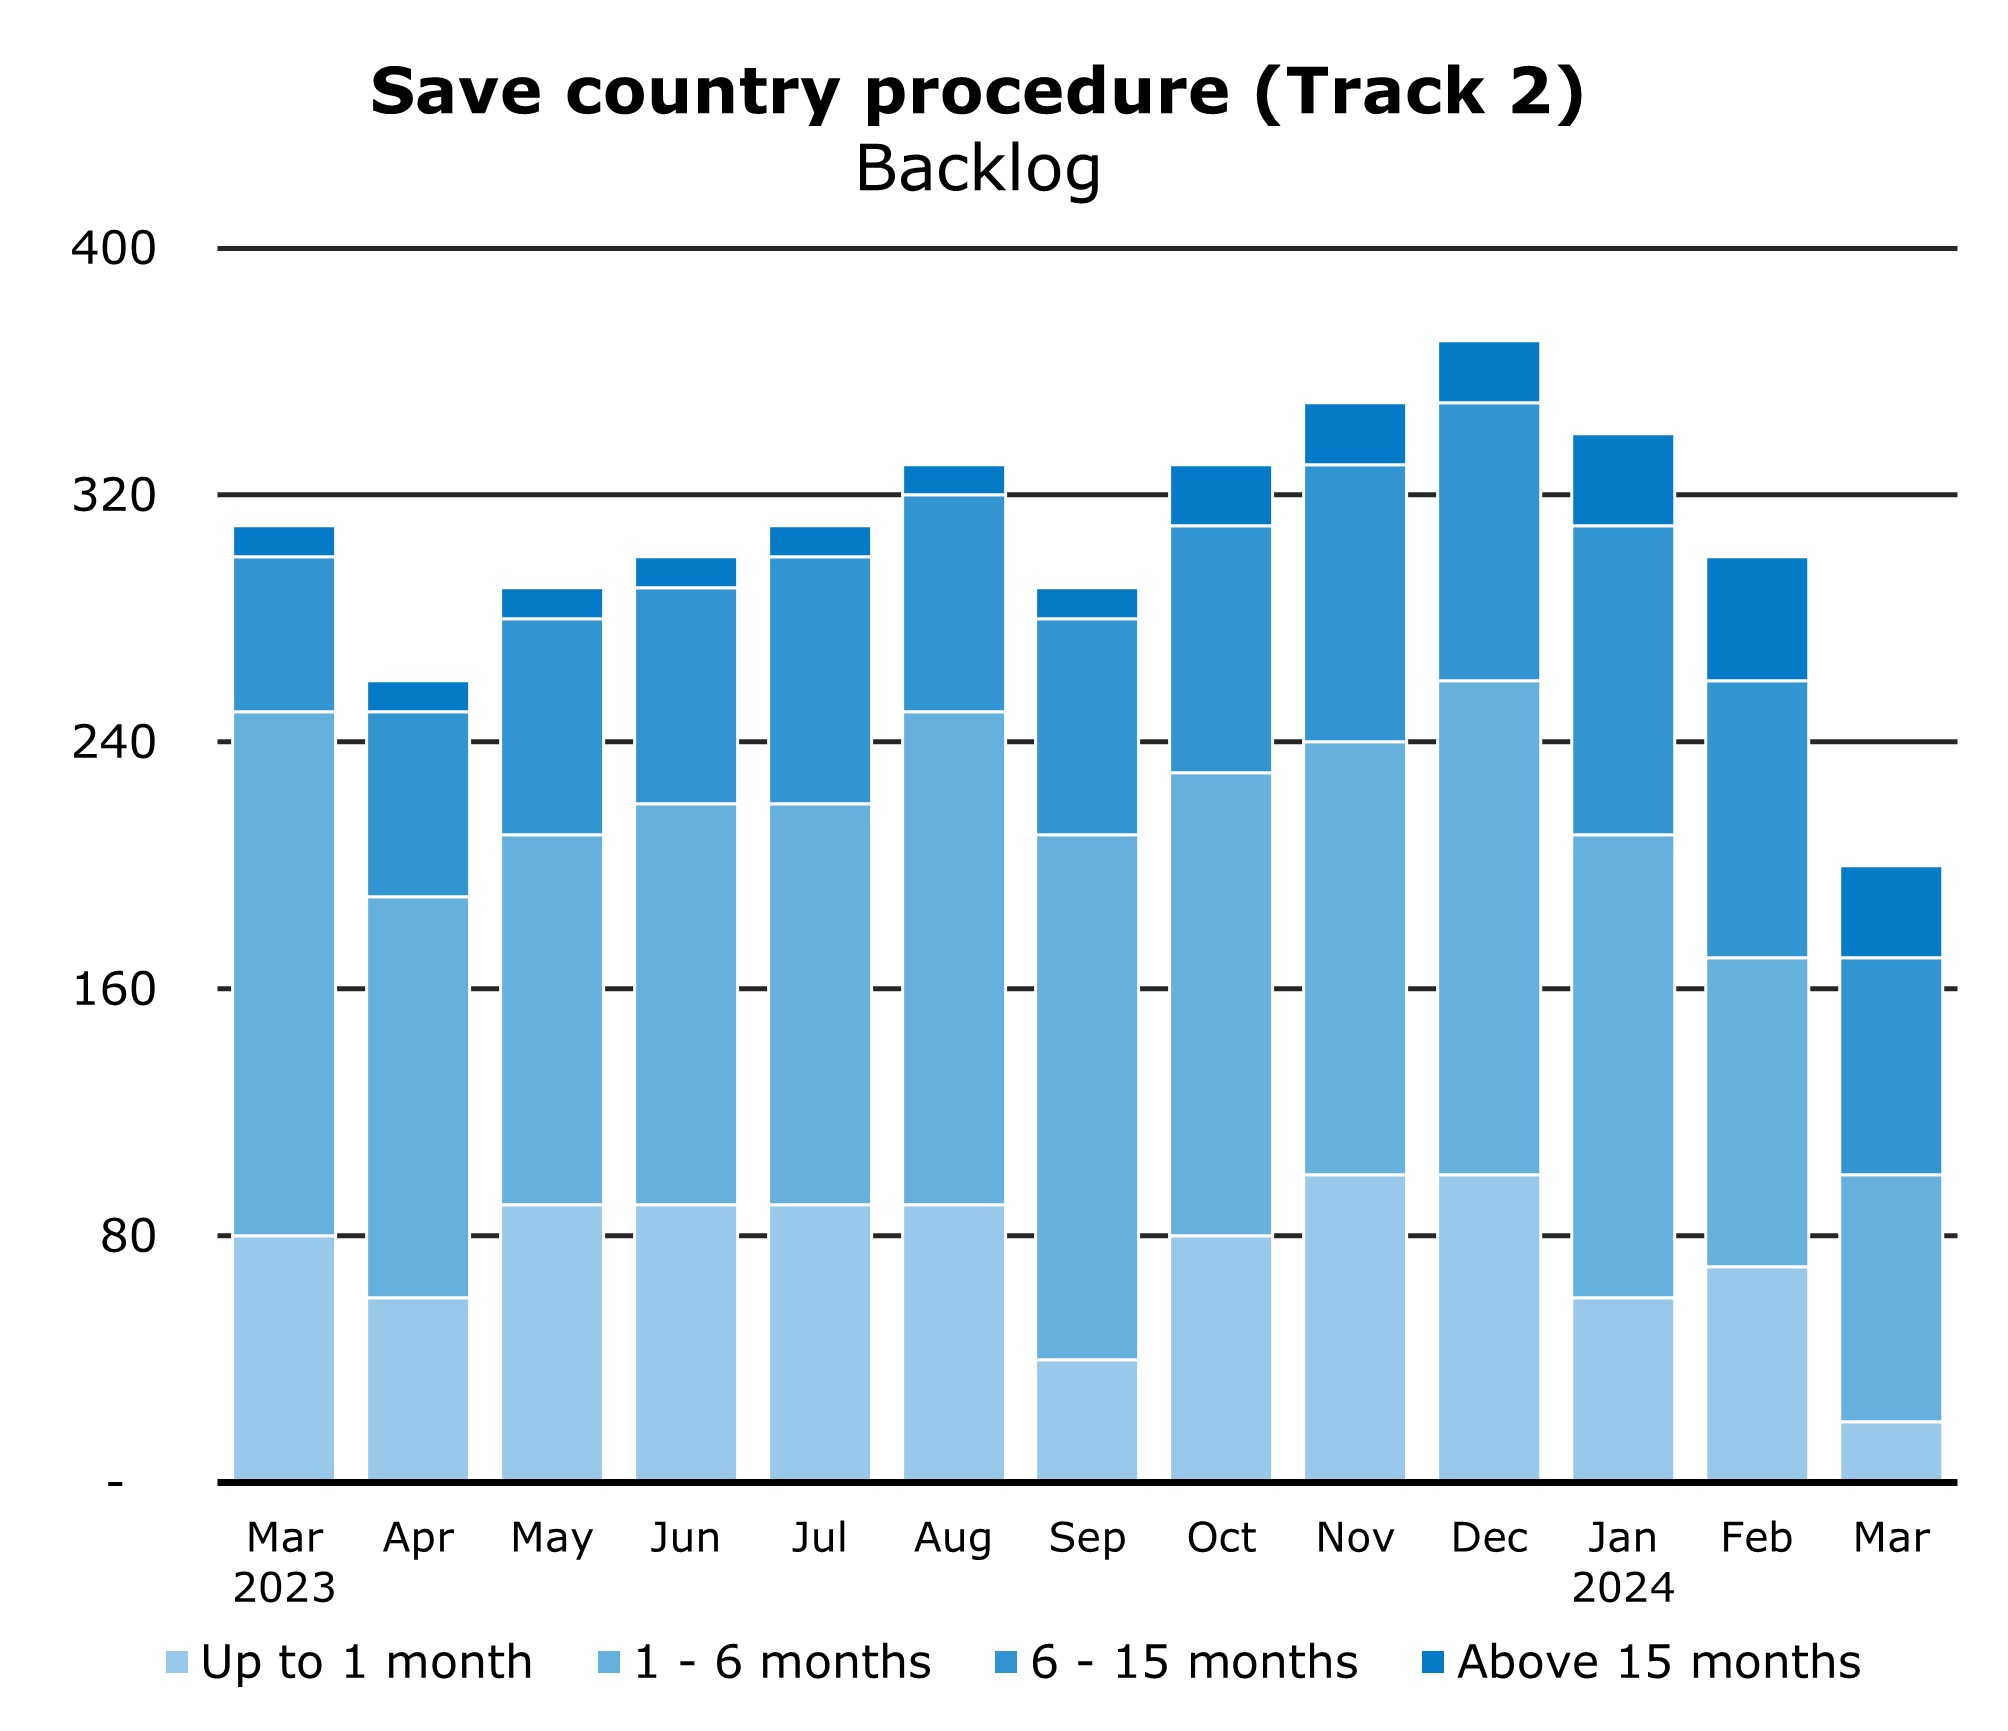 |
The number of outstanding applications in the safe countries procedure is constantly decreasing, to 200 in March. Only 30 new applications were received. Because of the decrease in the number of applications, fewer decisions were needed than estimated.
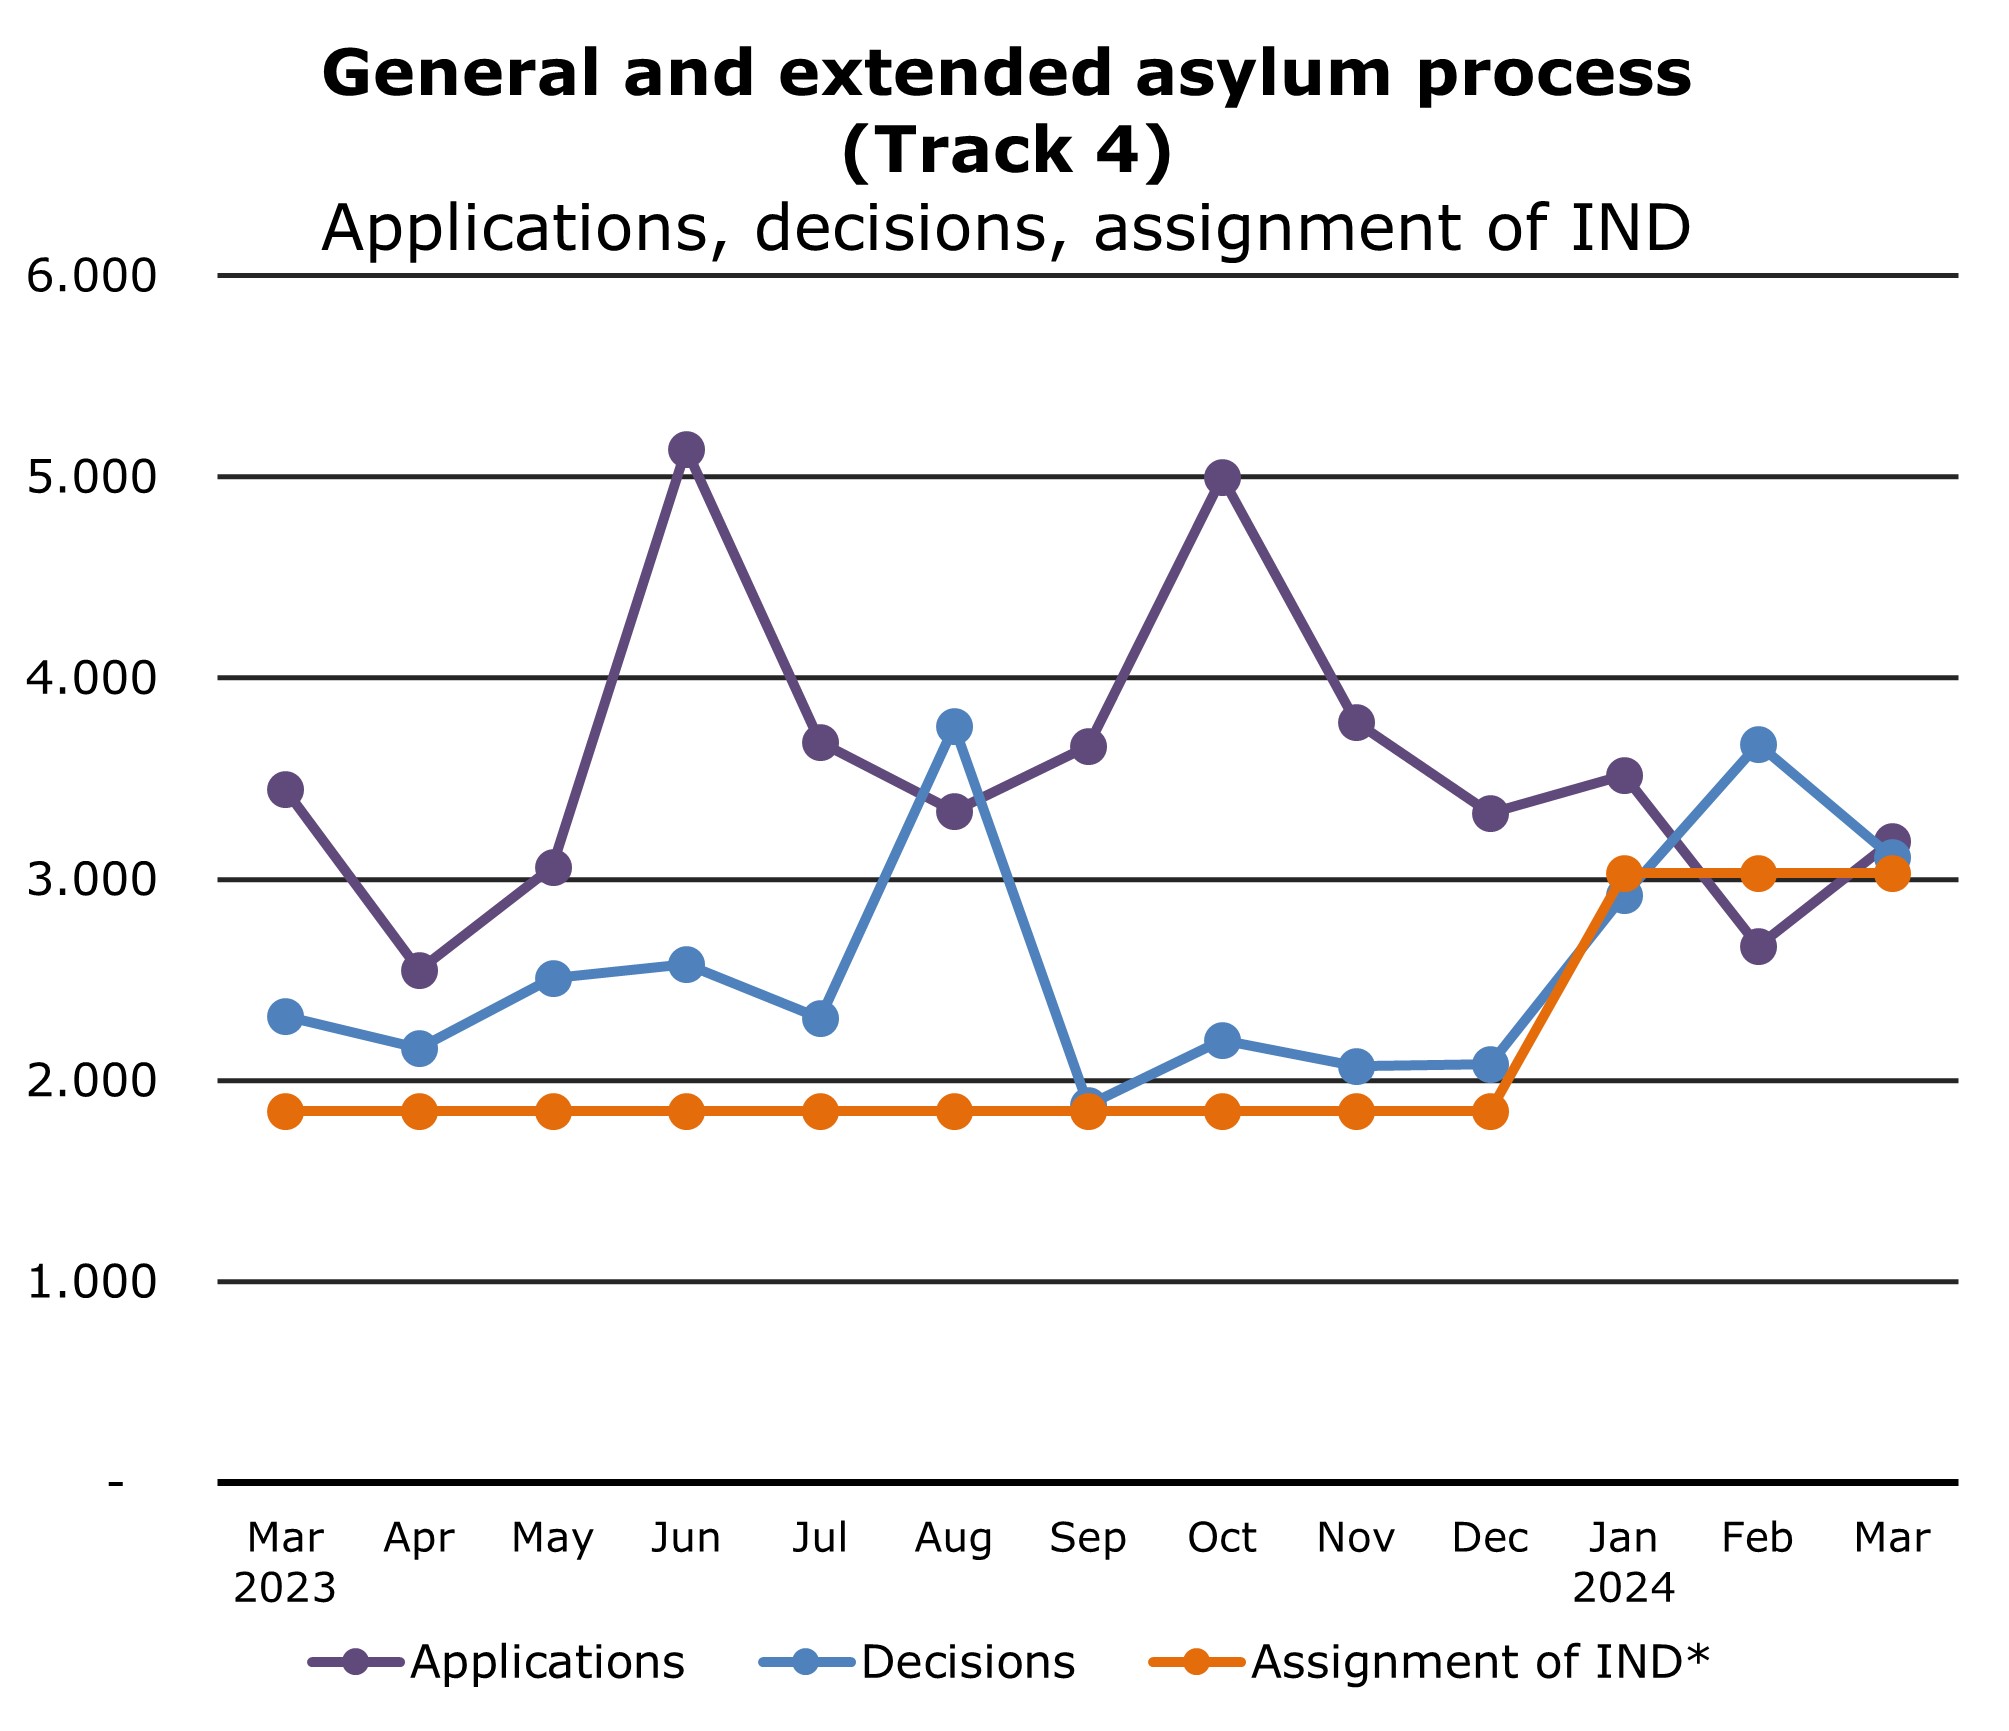
Asylum: General and extended asylum procedure (track 4)
 |
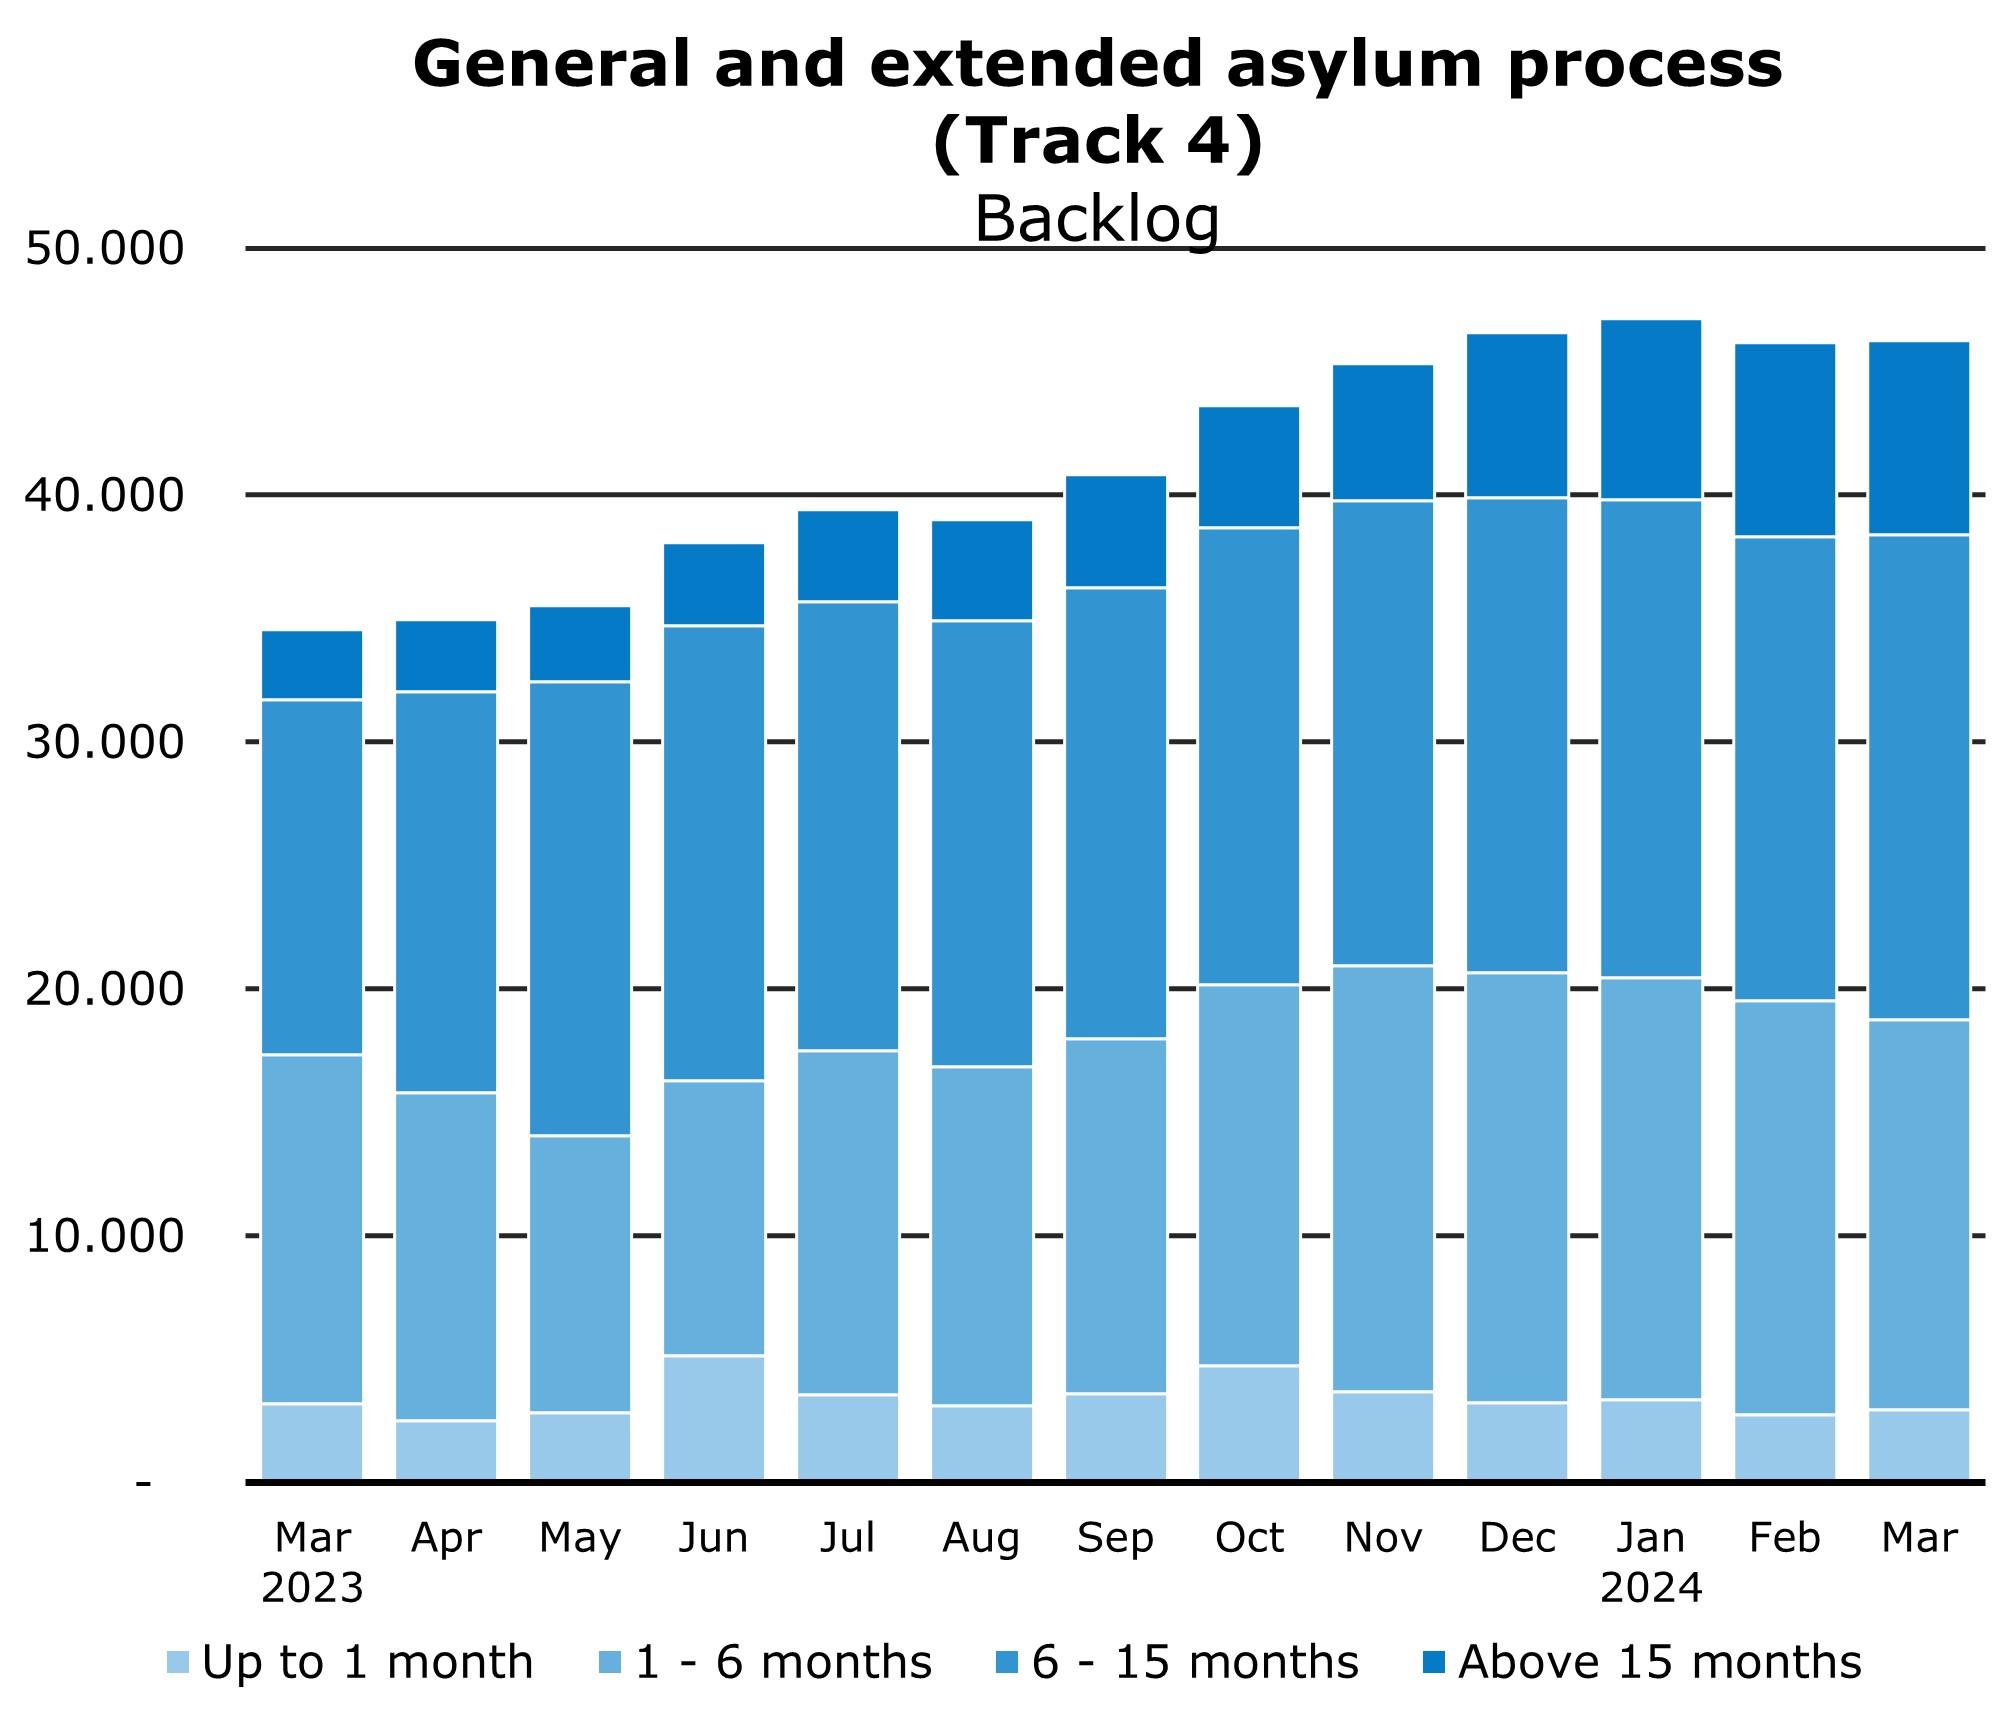 |
The IND took somewhat more decisions than estimated: 3,110, whereas 3,030 were estimated. The number of applications rose from 2,670 to 3,190. This resulted in an increase in the number of outstanding applications. Despite the fact that the IND does more than that for which the organisation is equipped, more and more applicants have to wait a long time for a decision.
* This diagram shows the first asylum applications, repeated applications, lateral entries and resettlement.
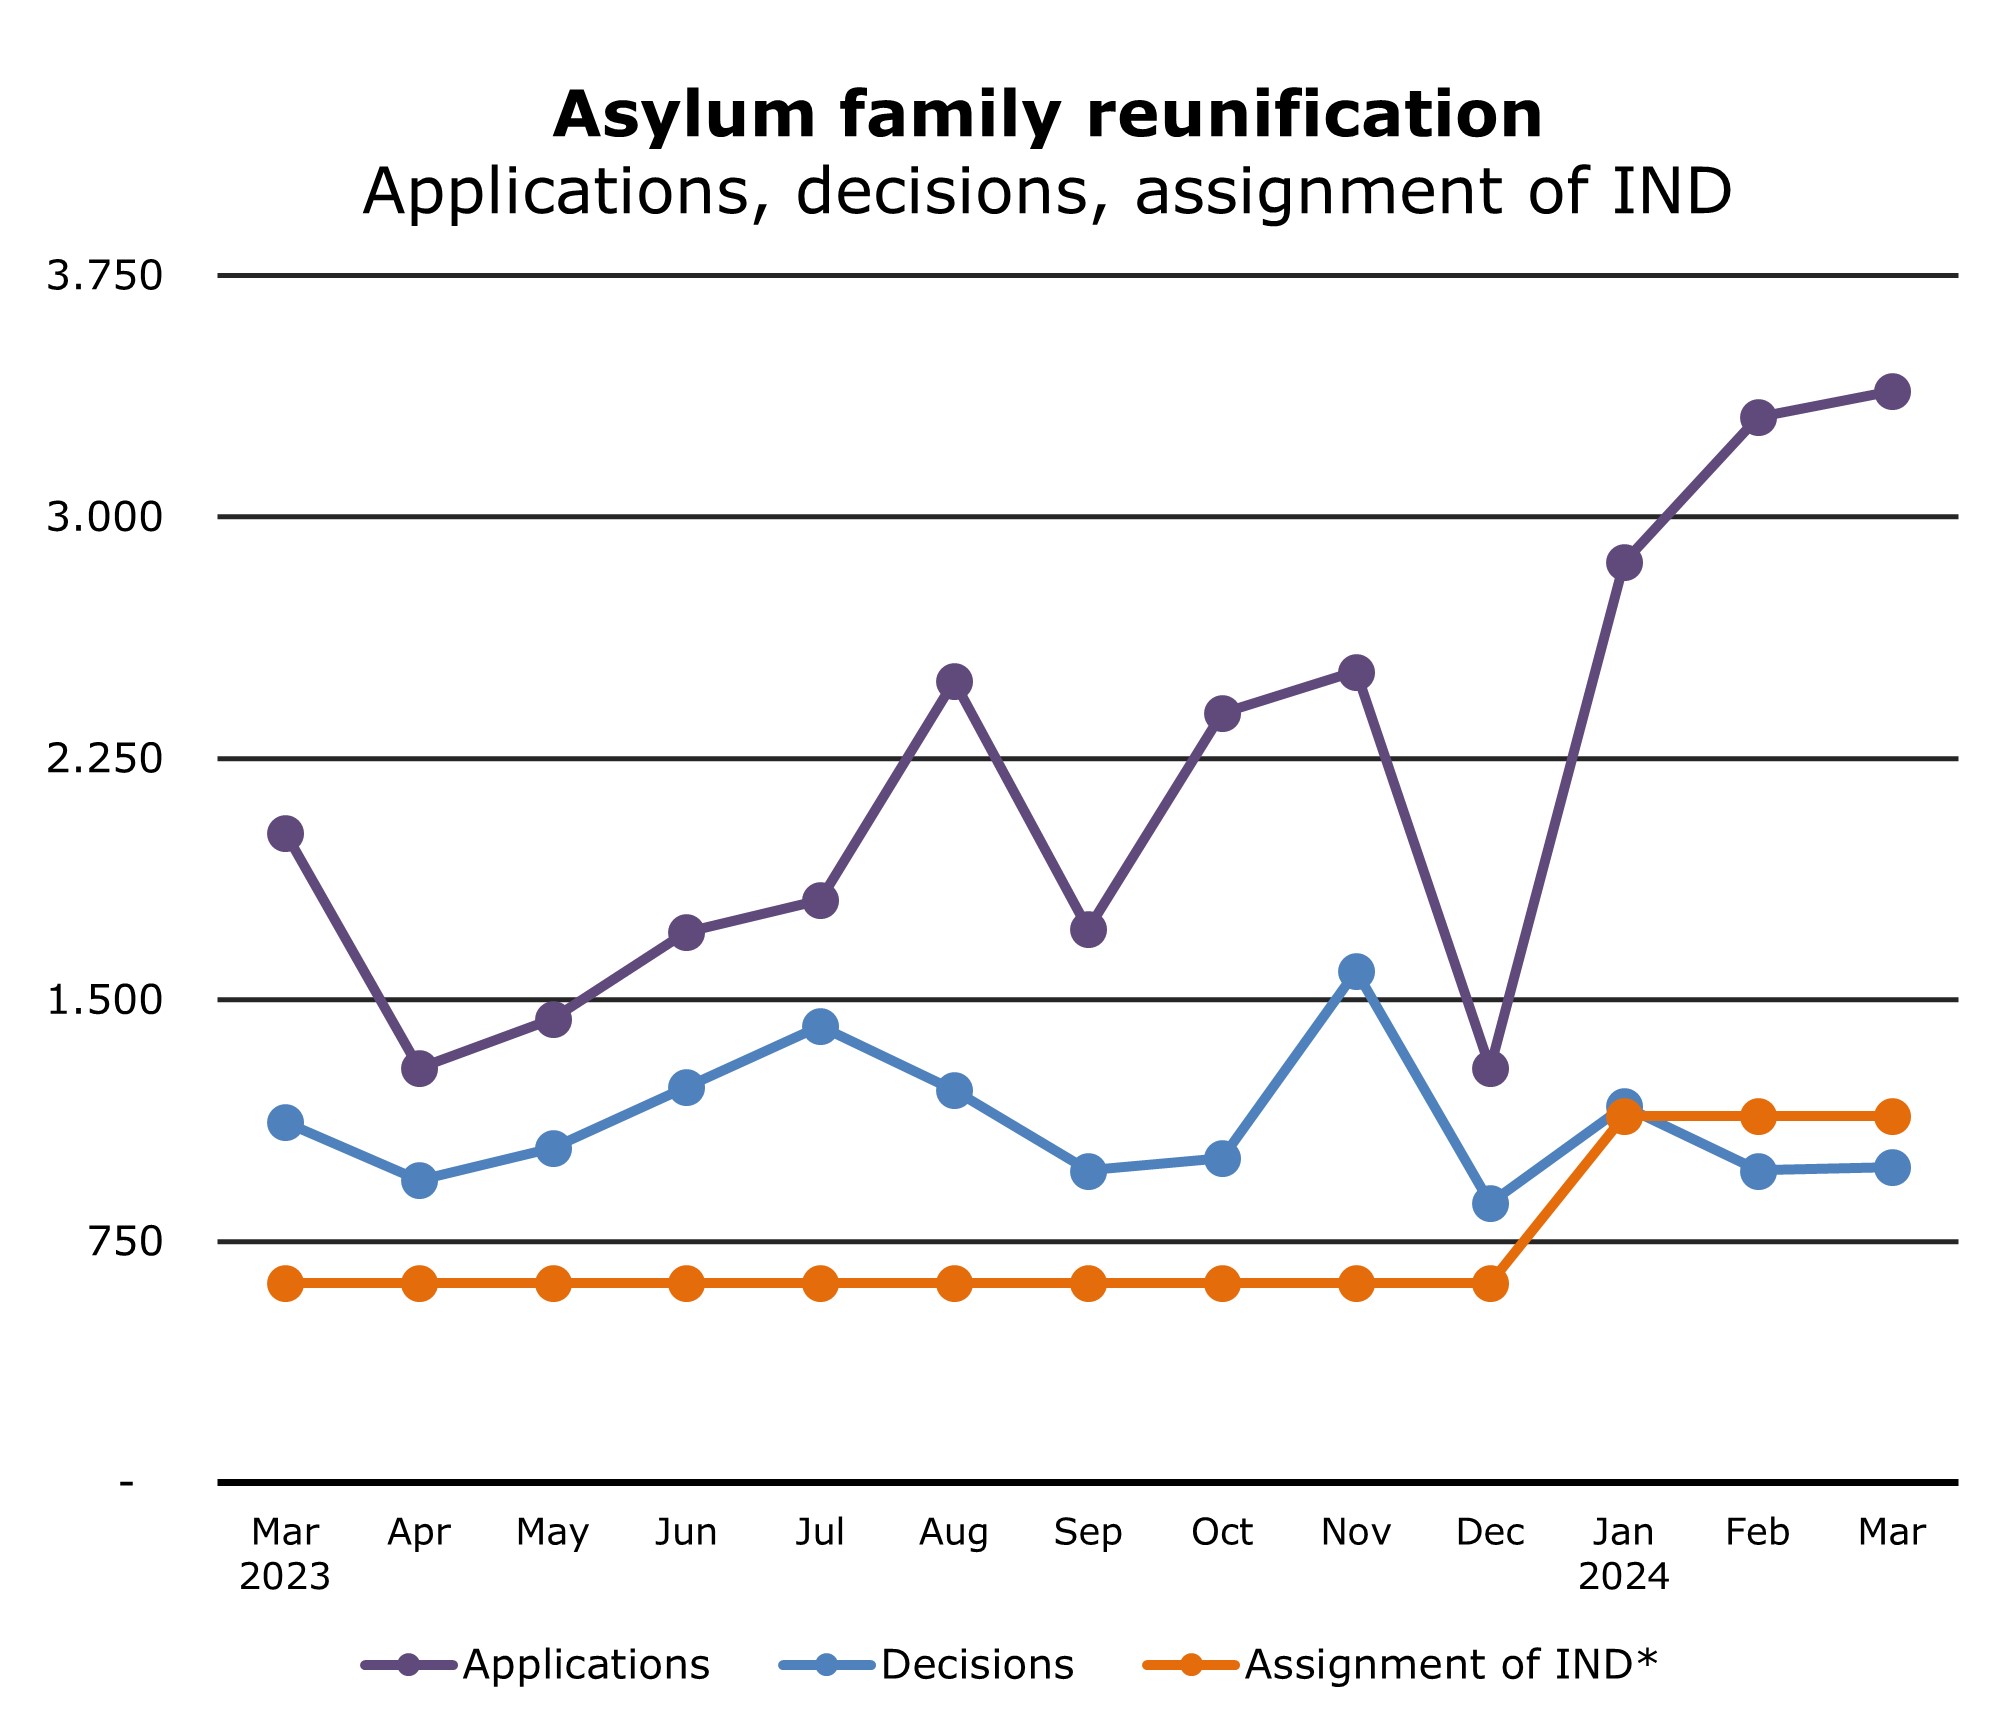
Asylum: Family members who have joined the asylum seekers later
 |
 |
The estimated number of applications by family members of refugees that the IND must process this year is higher than last year. With 980 decisions, the IND processed fewer applications than was estimated. Because of the quicker processing of applications that have a good chance of resulting in a residence permit in the preceding months, the number of applications was high again, with 3,390 applications from family members of refugees in March.
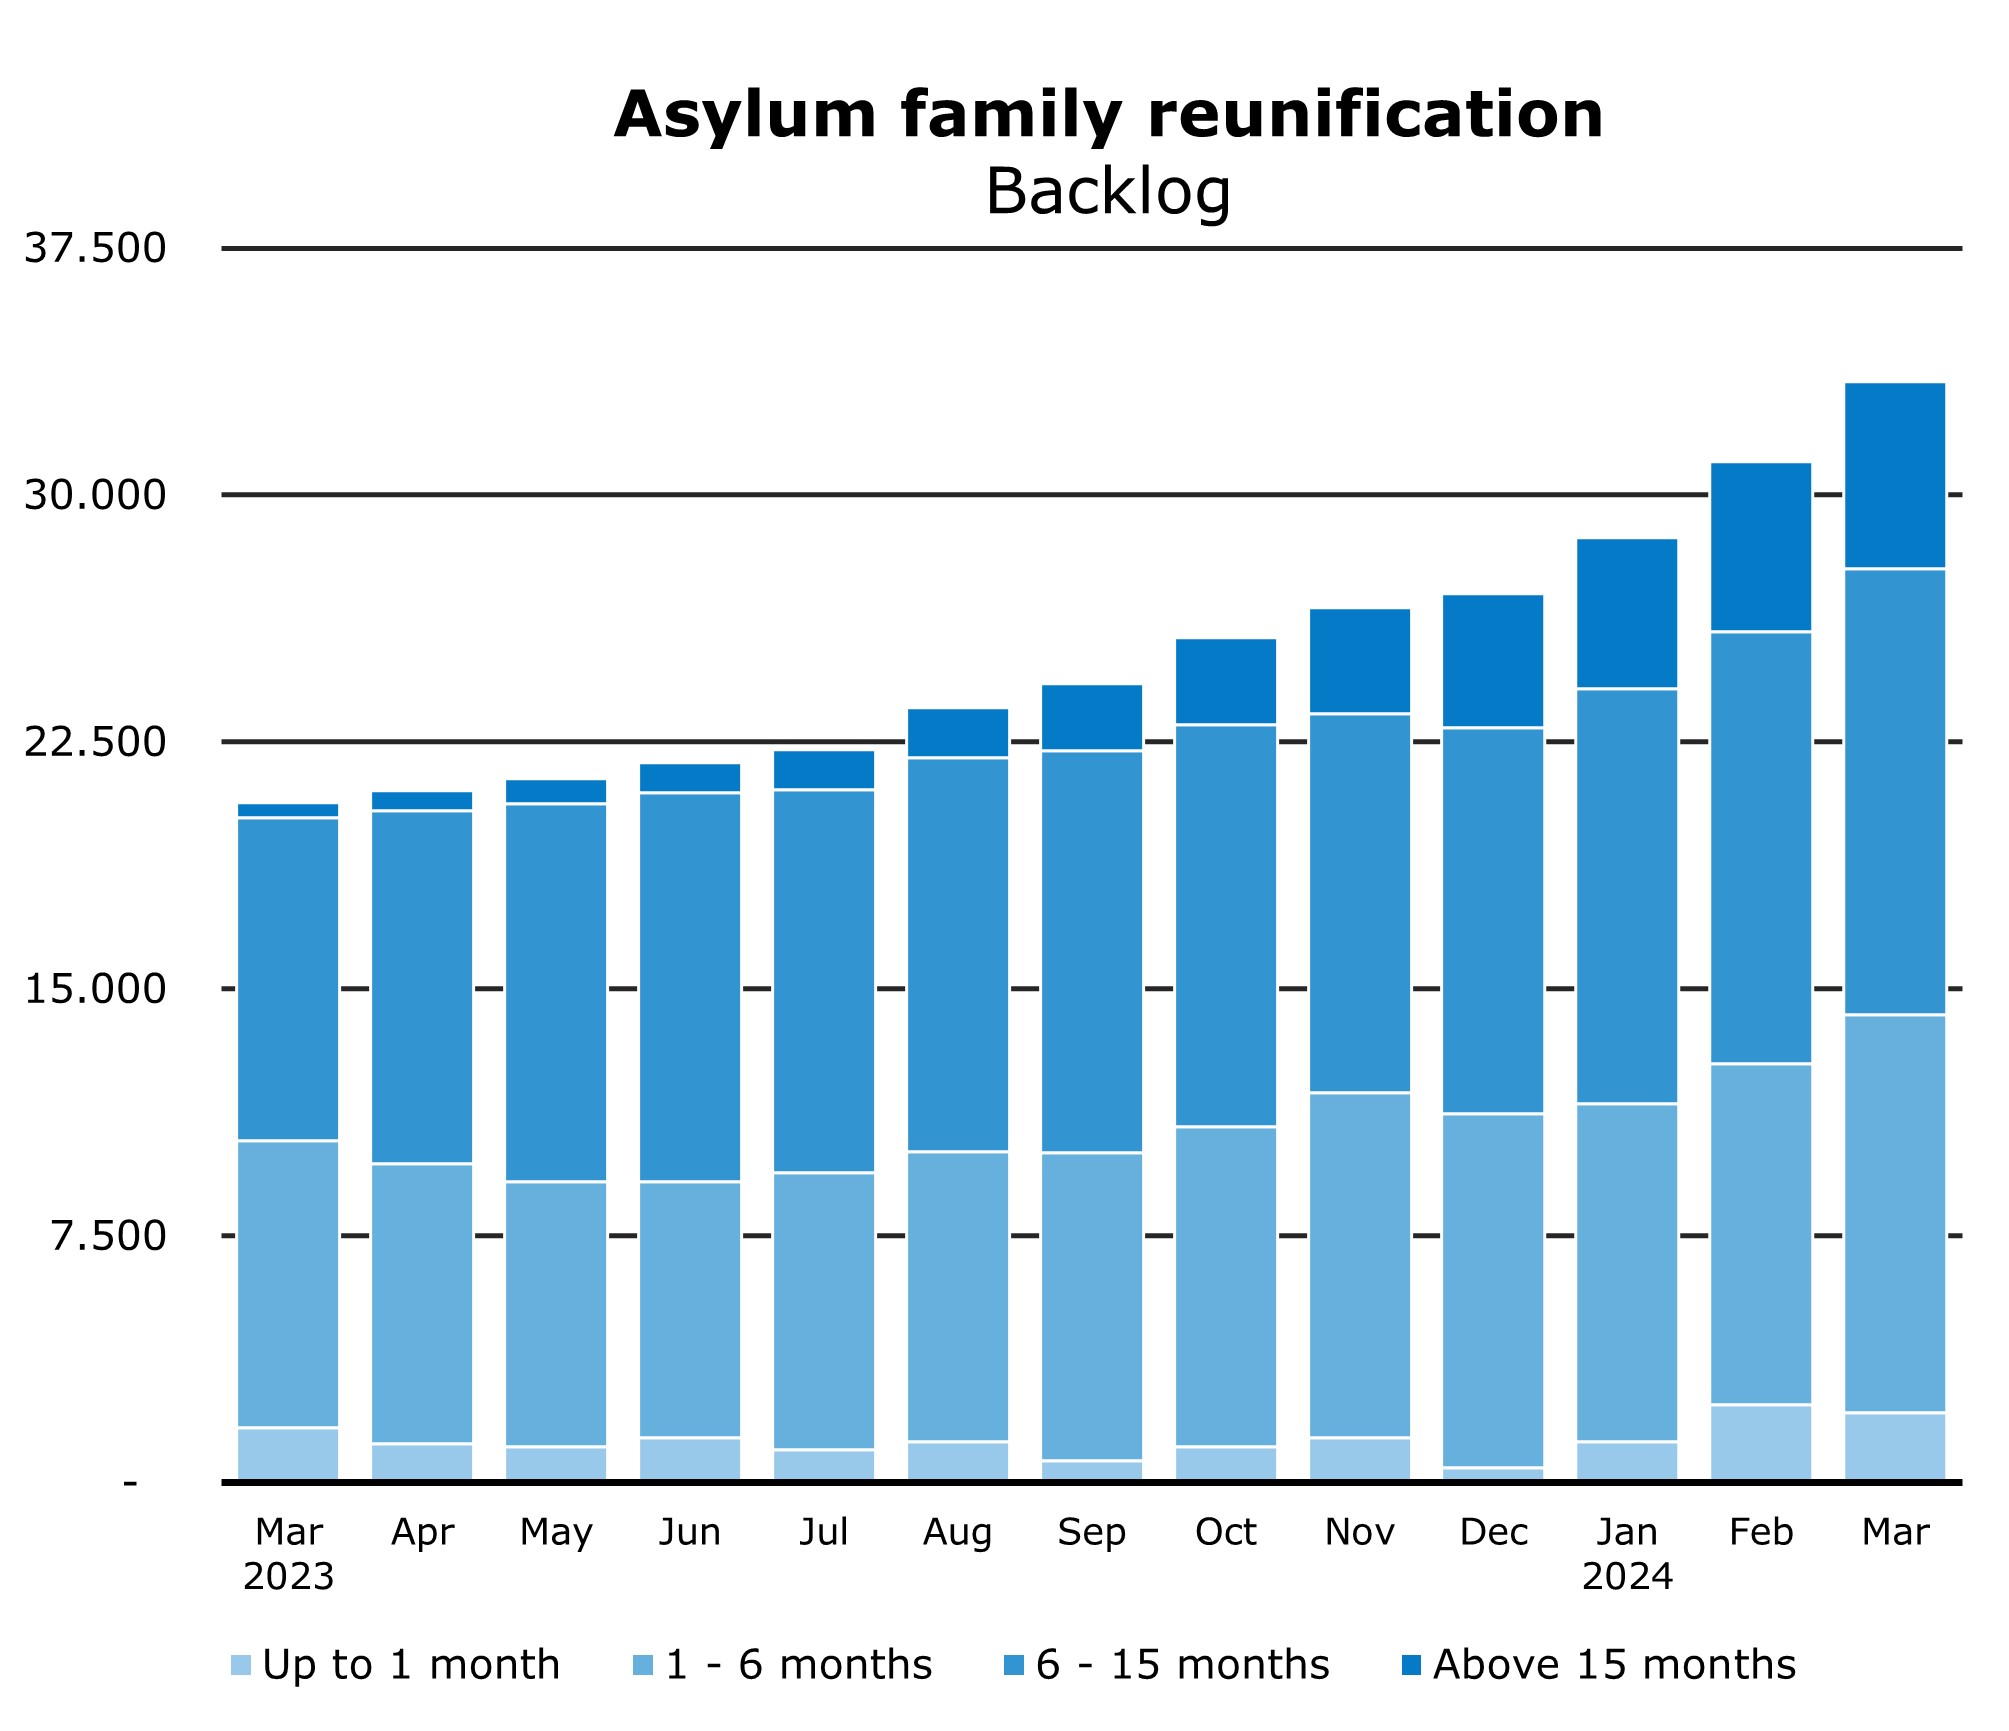
The number of family members of asylum permit holders waiting for decisions on their applications rose to 33,440.
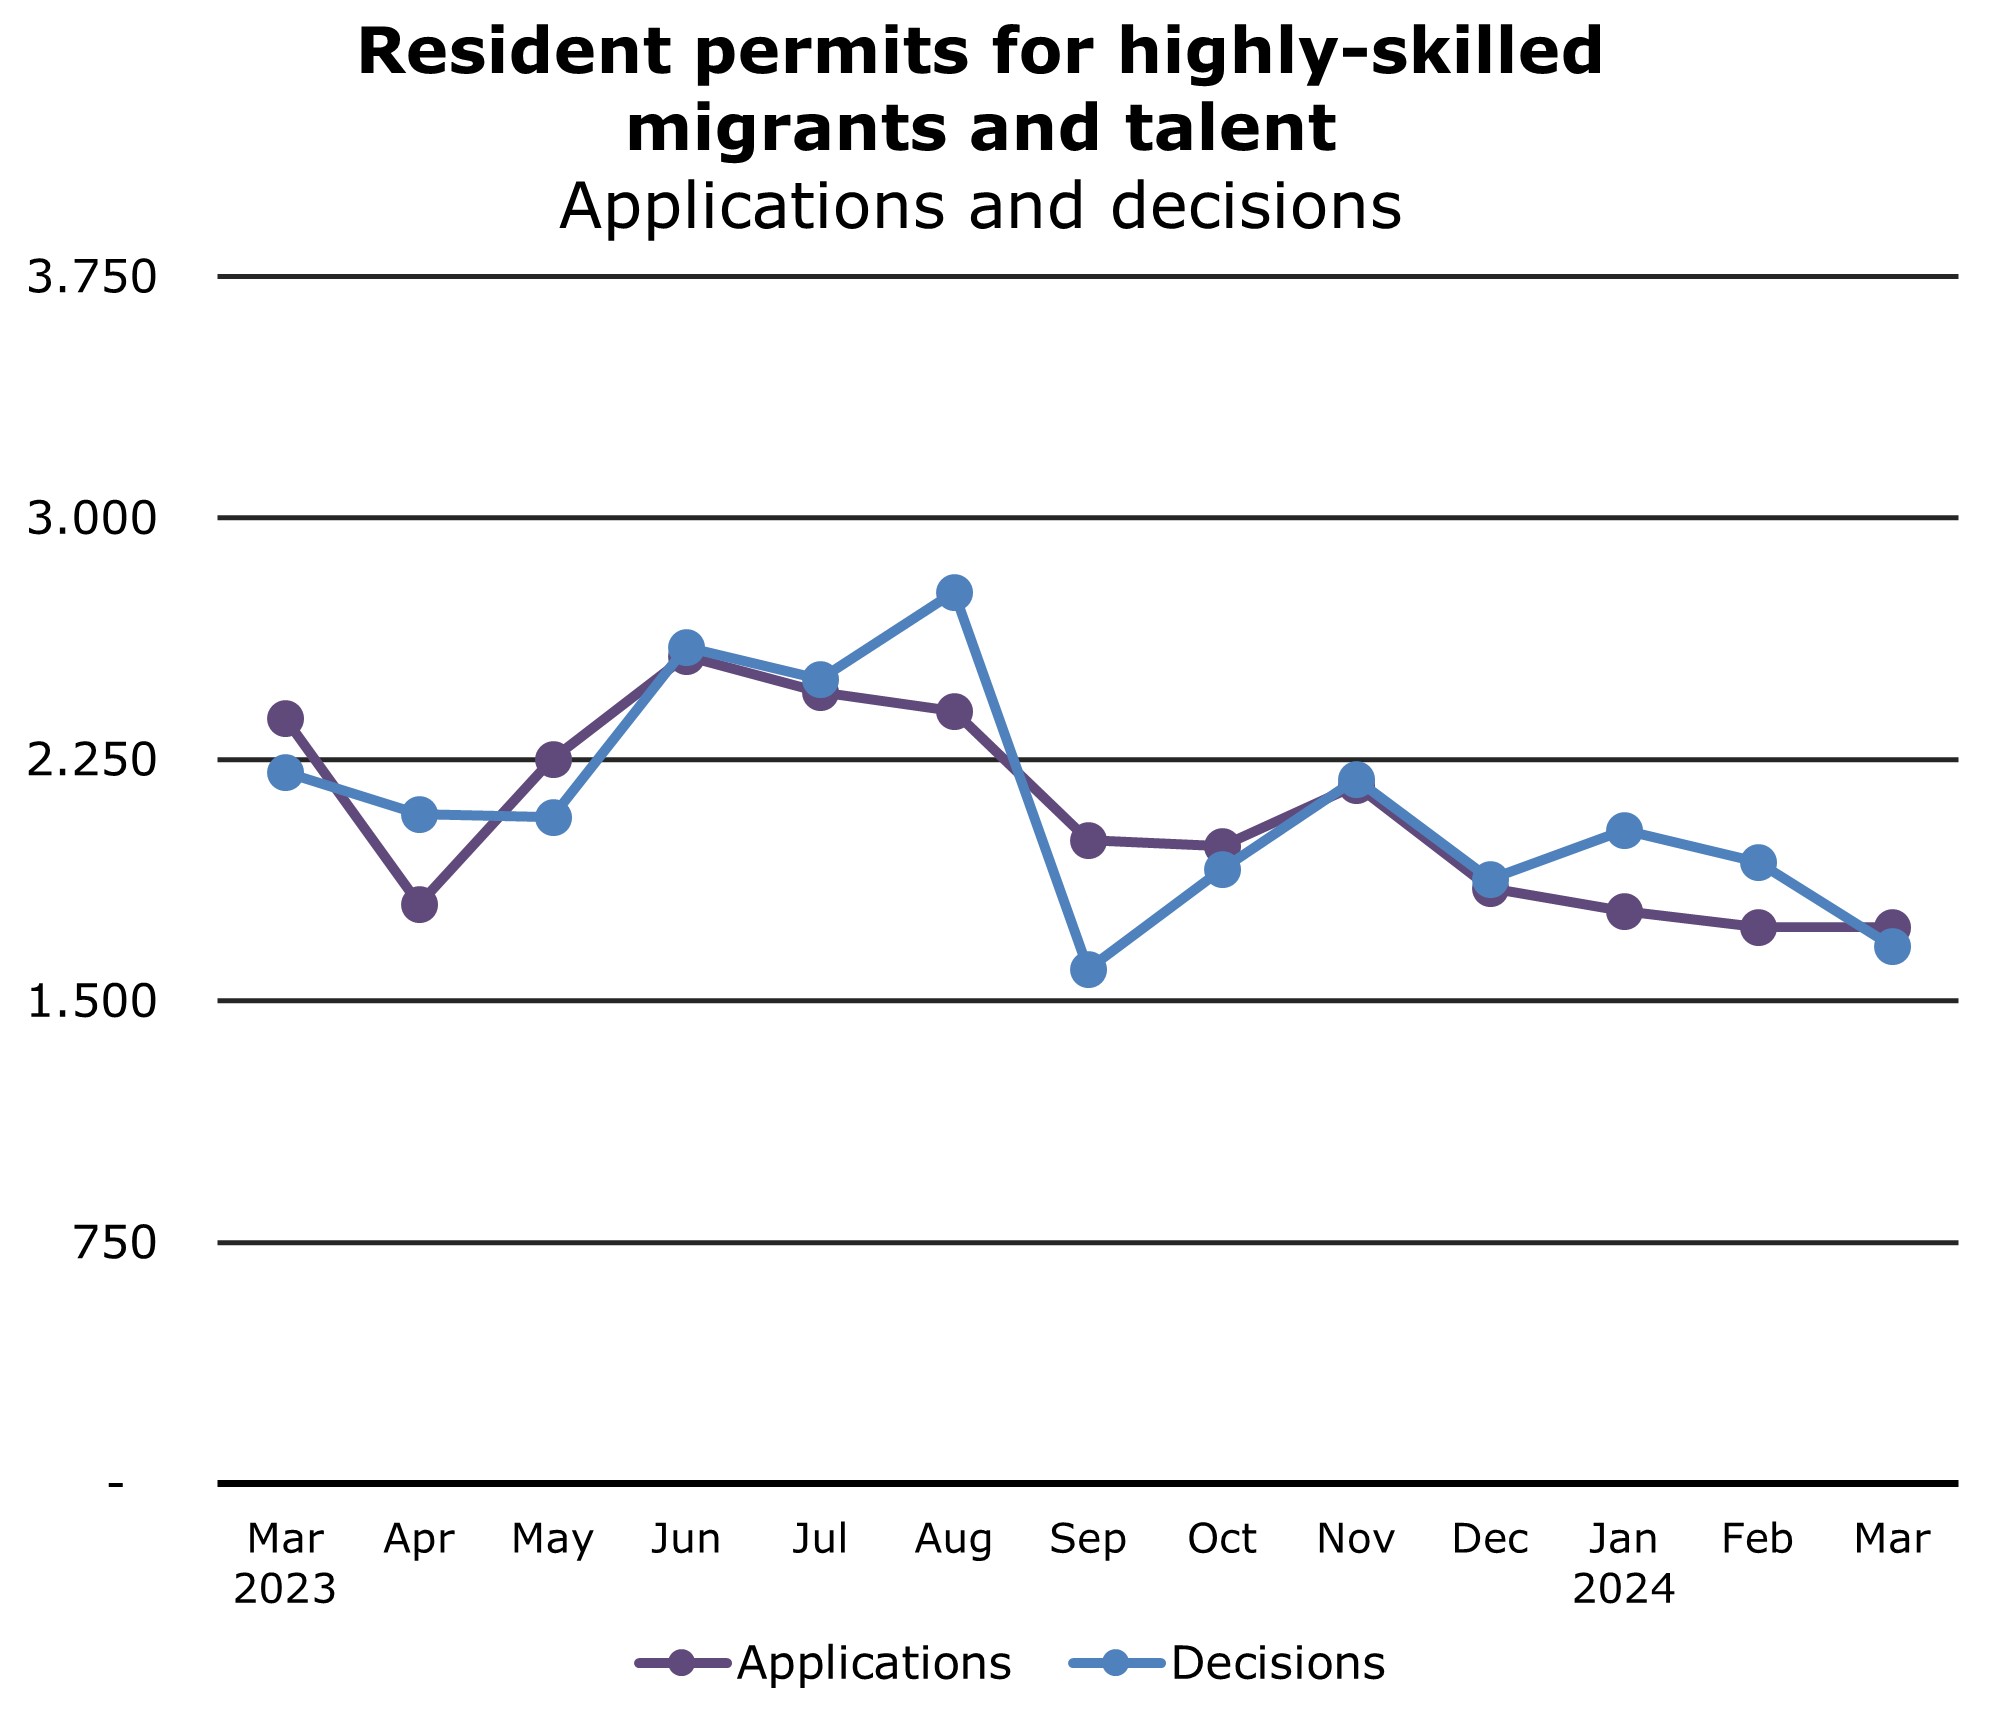
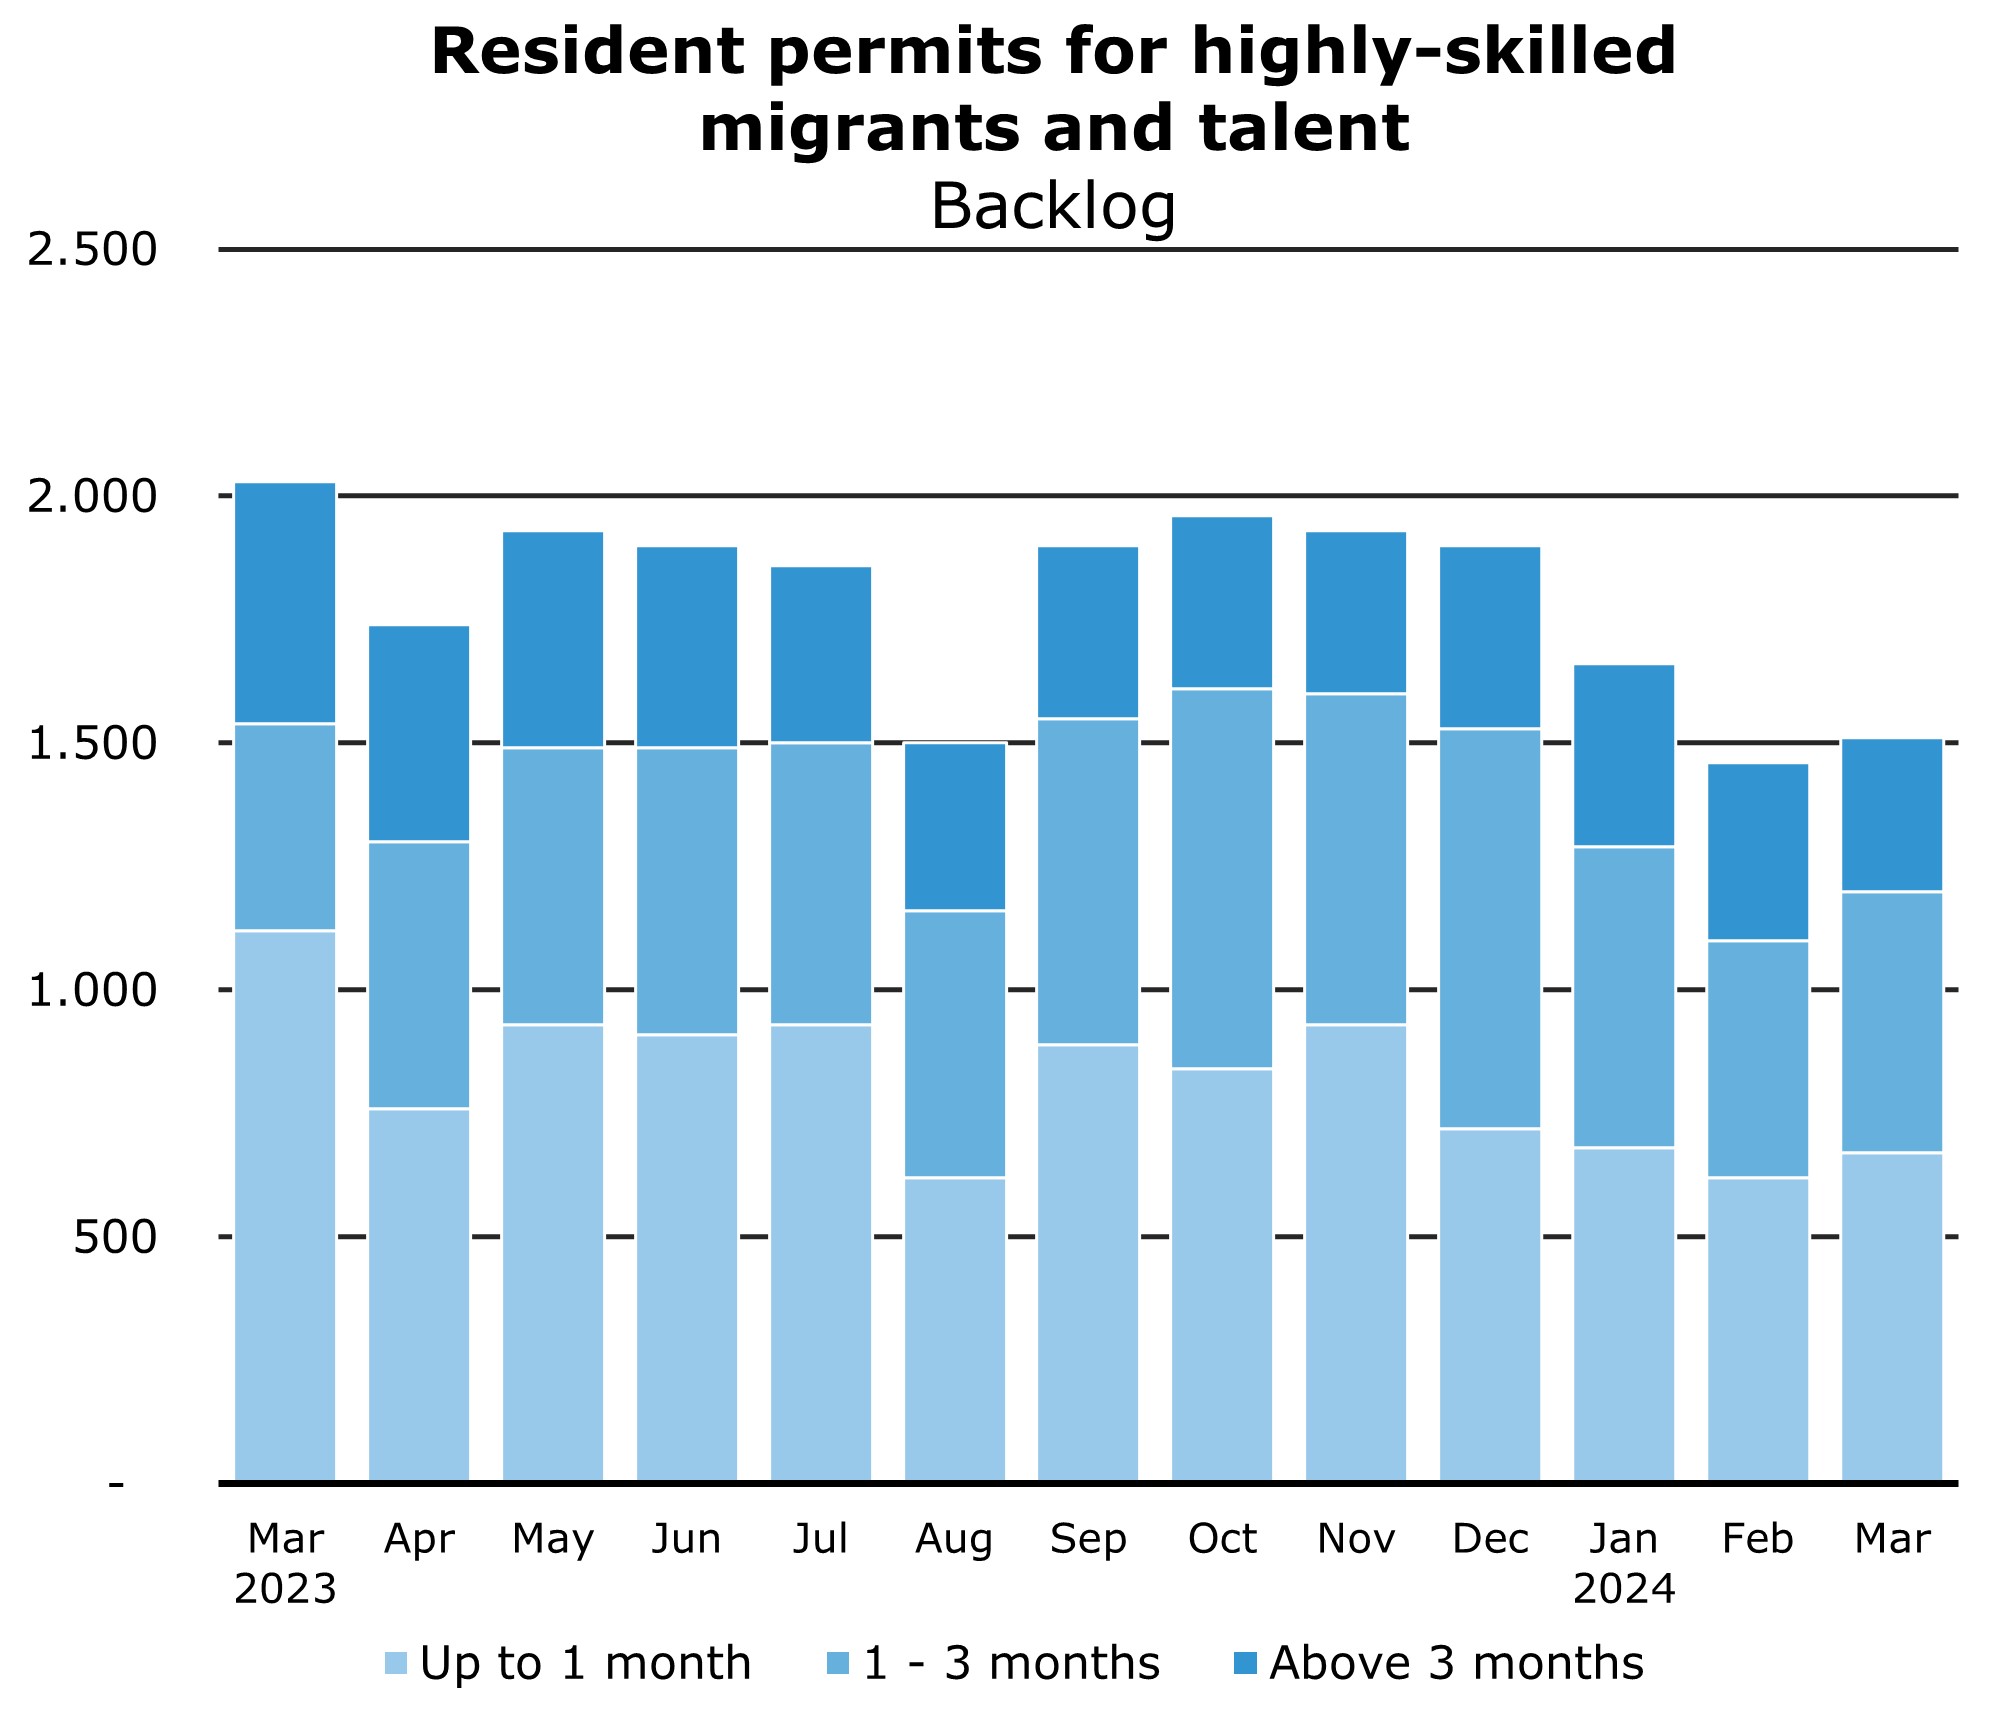
Residence permit knowledge and talent
 |
 |
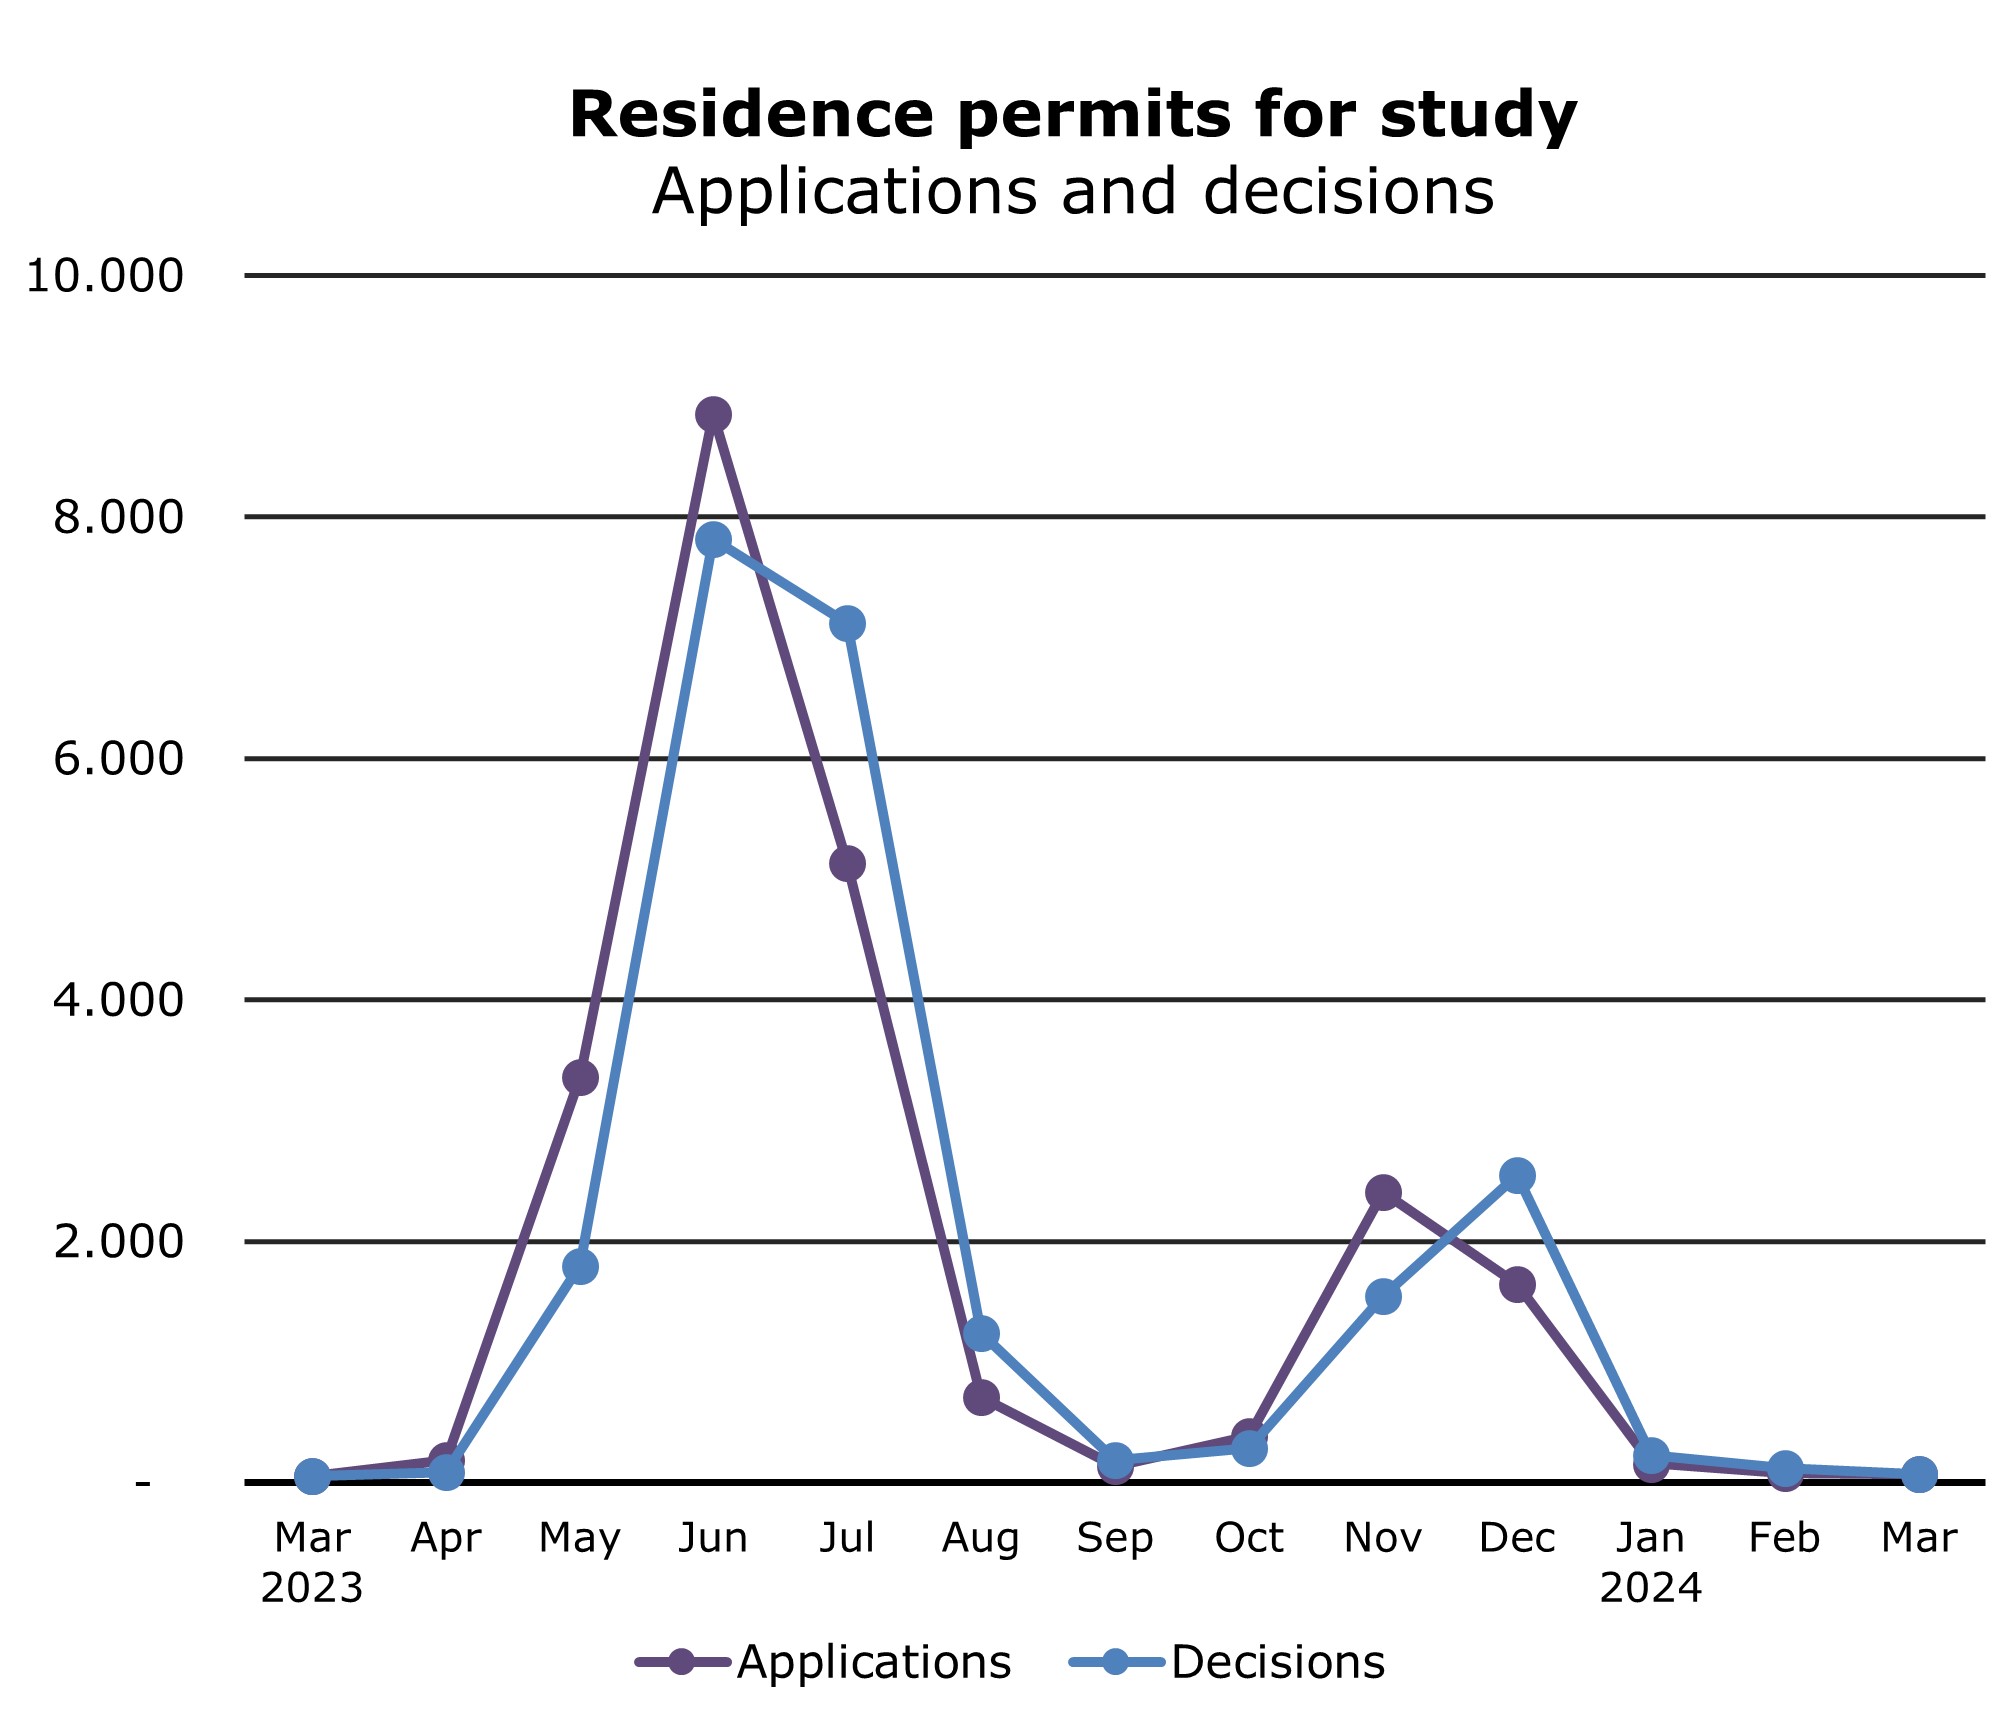
Study
 |
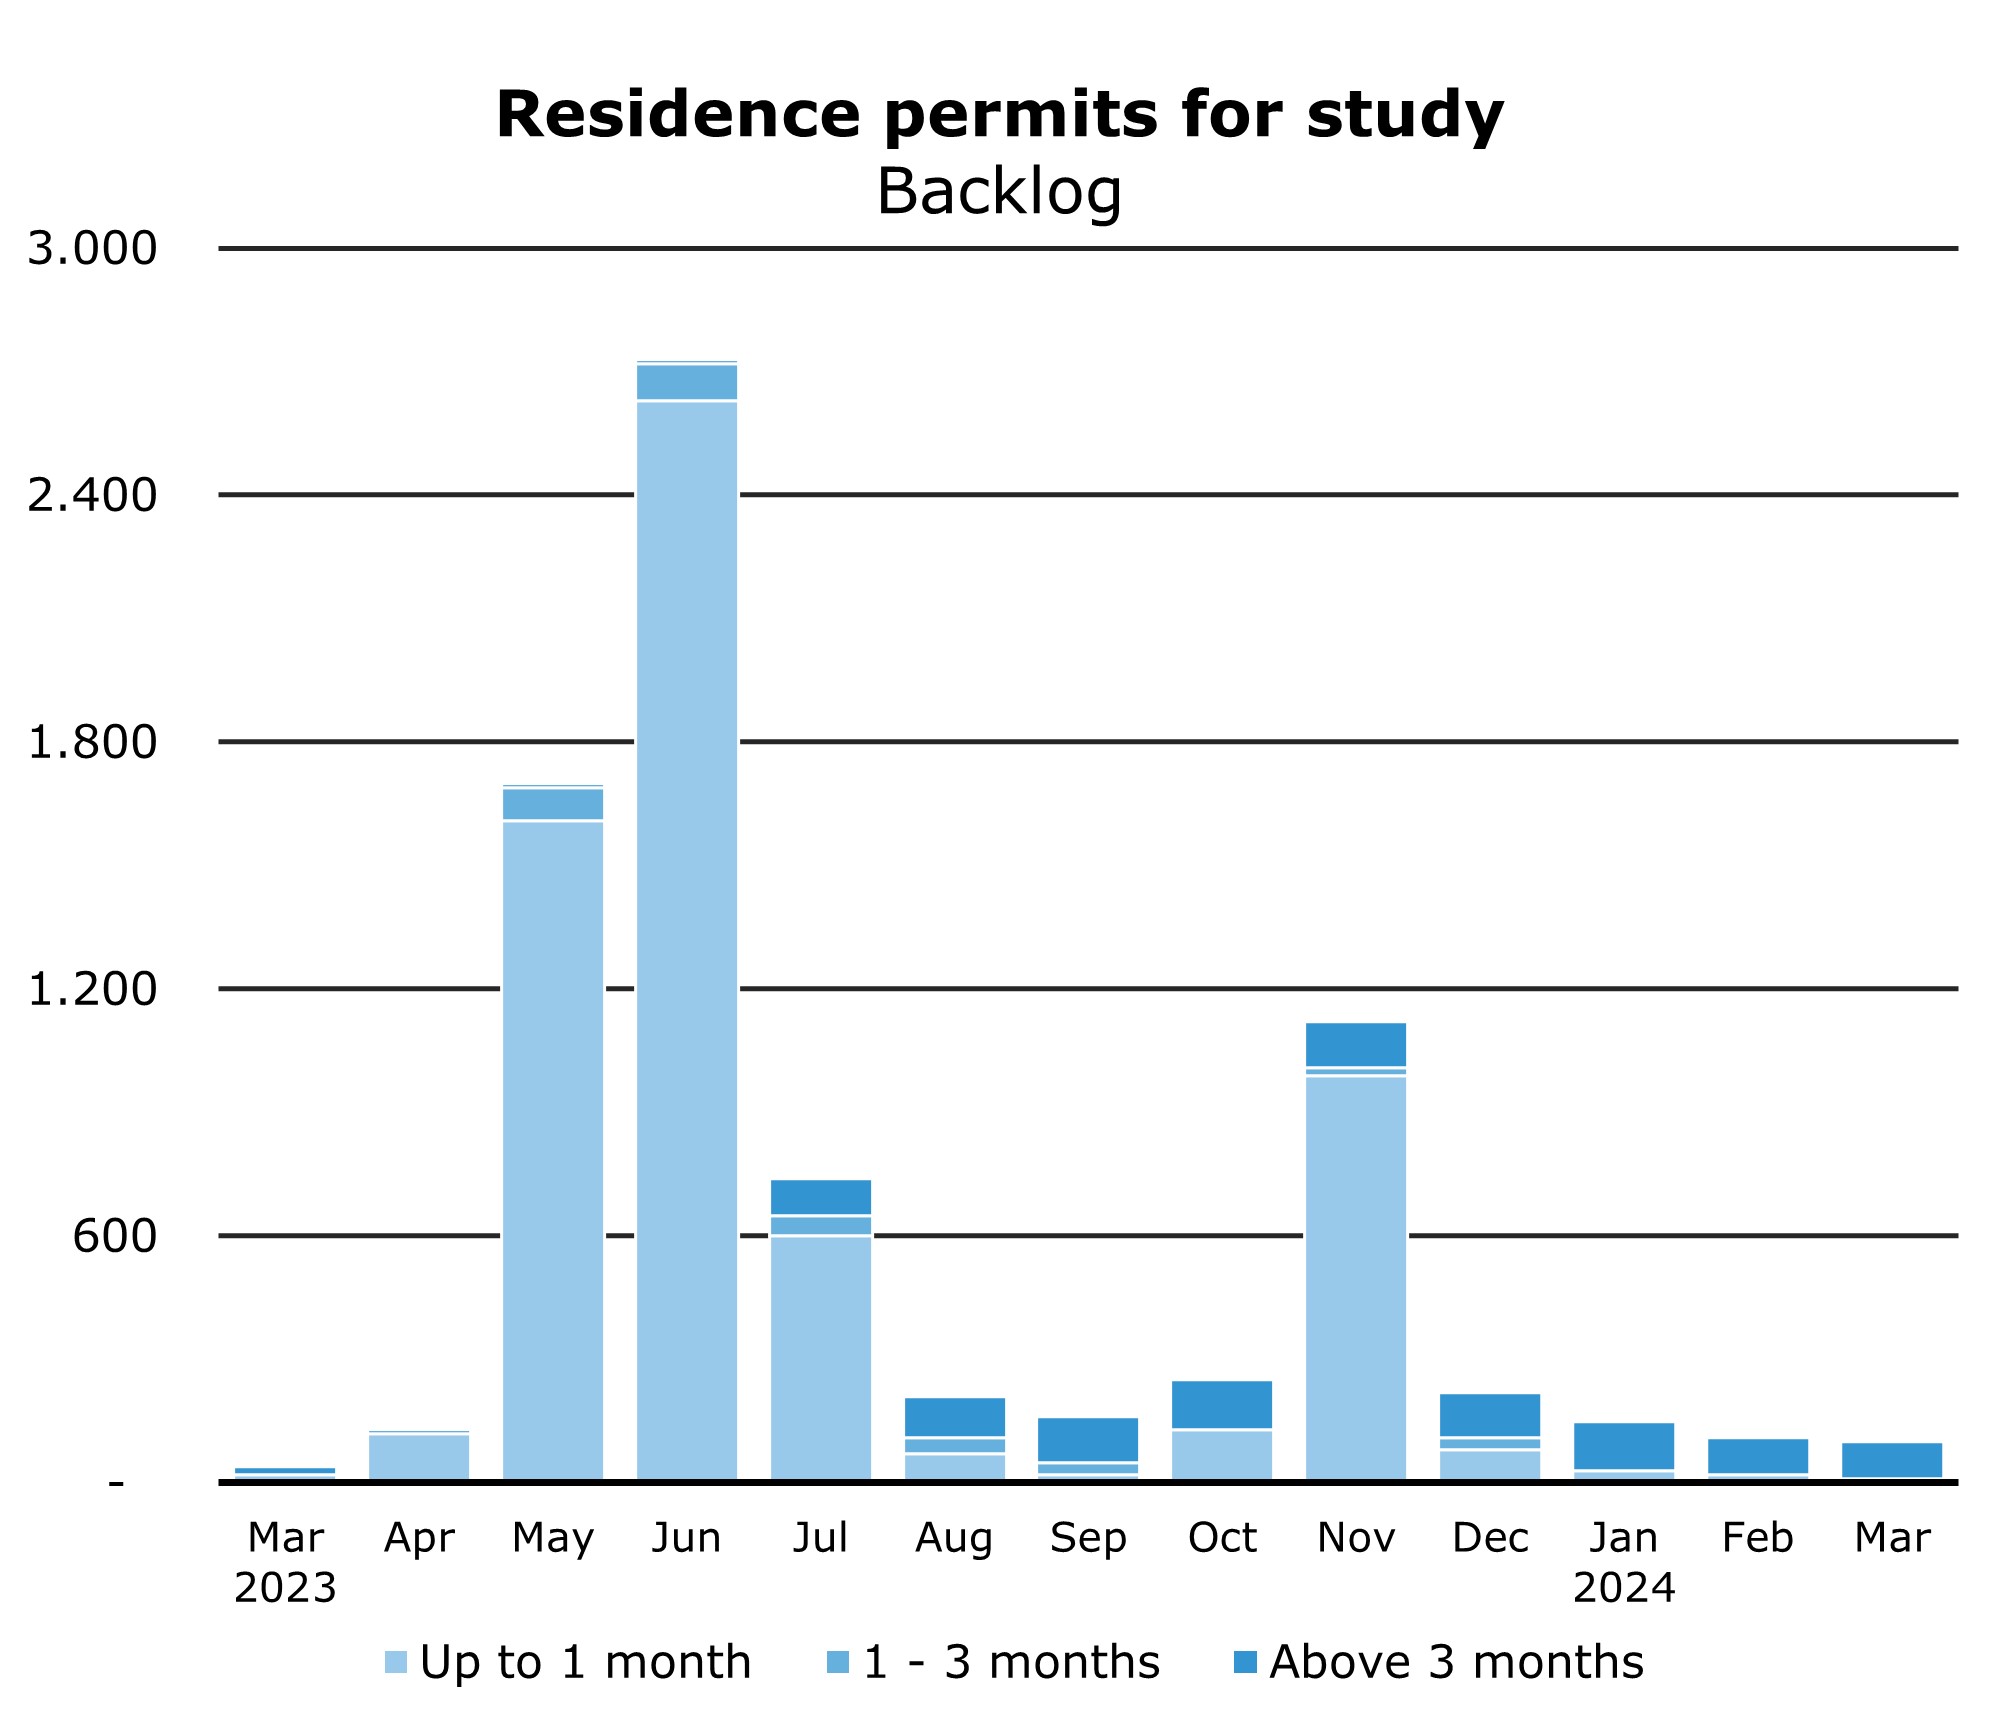 |
The study applications have a peak pattern. Most applications are submitted before the start of the academic year (in September and February). The numbers of applications for the start in September are larger than those for the start in February.
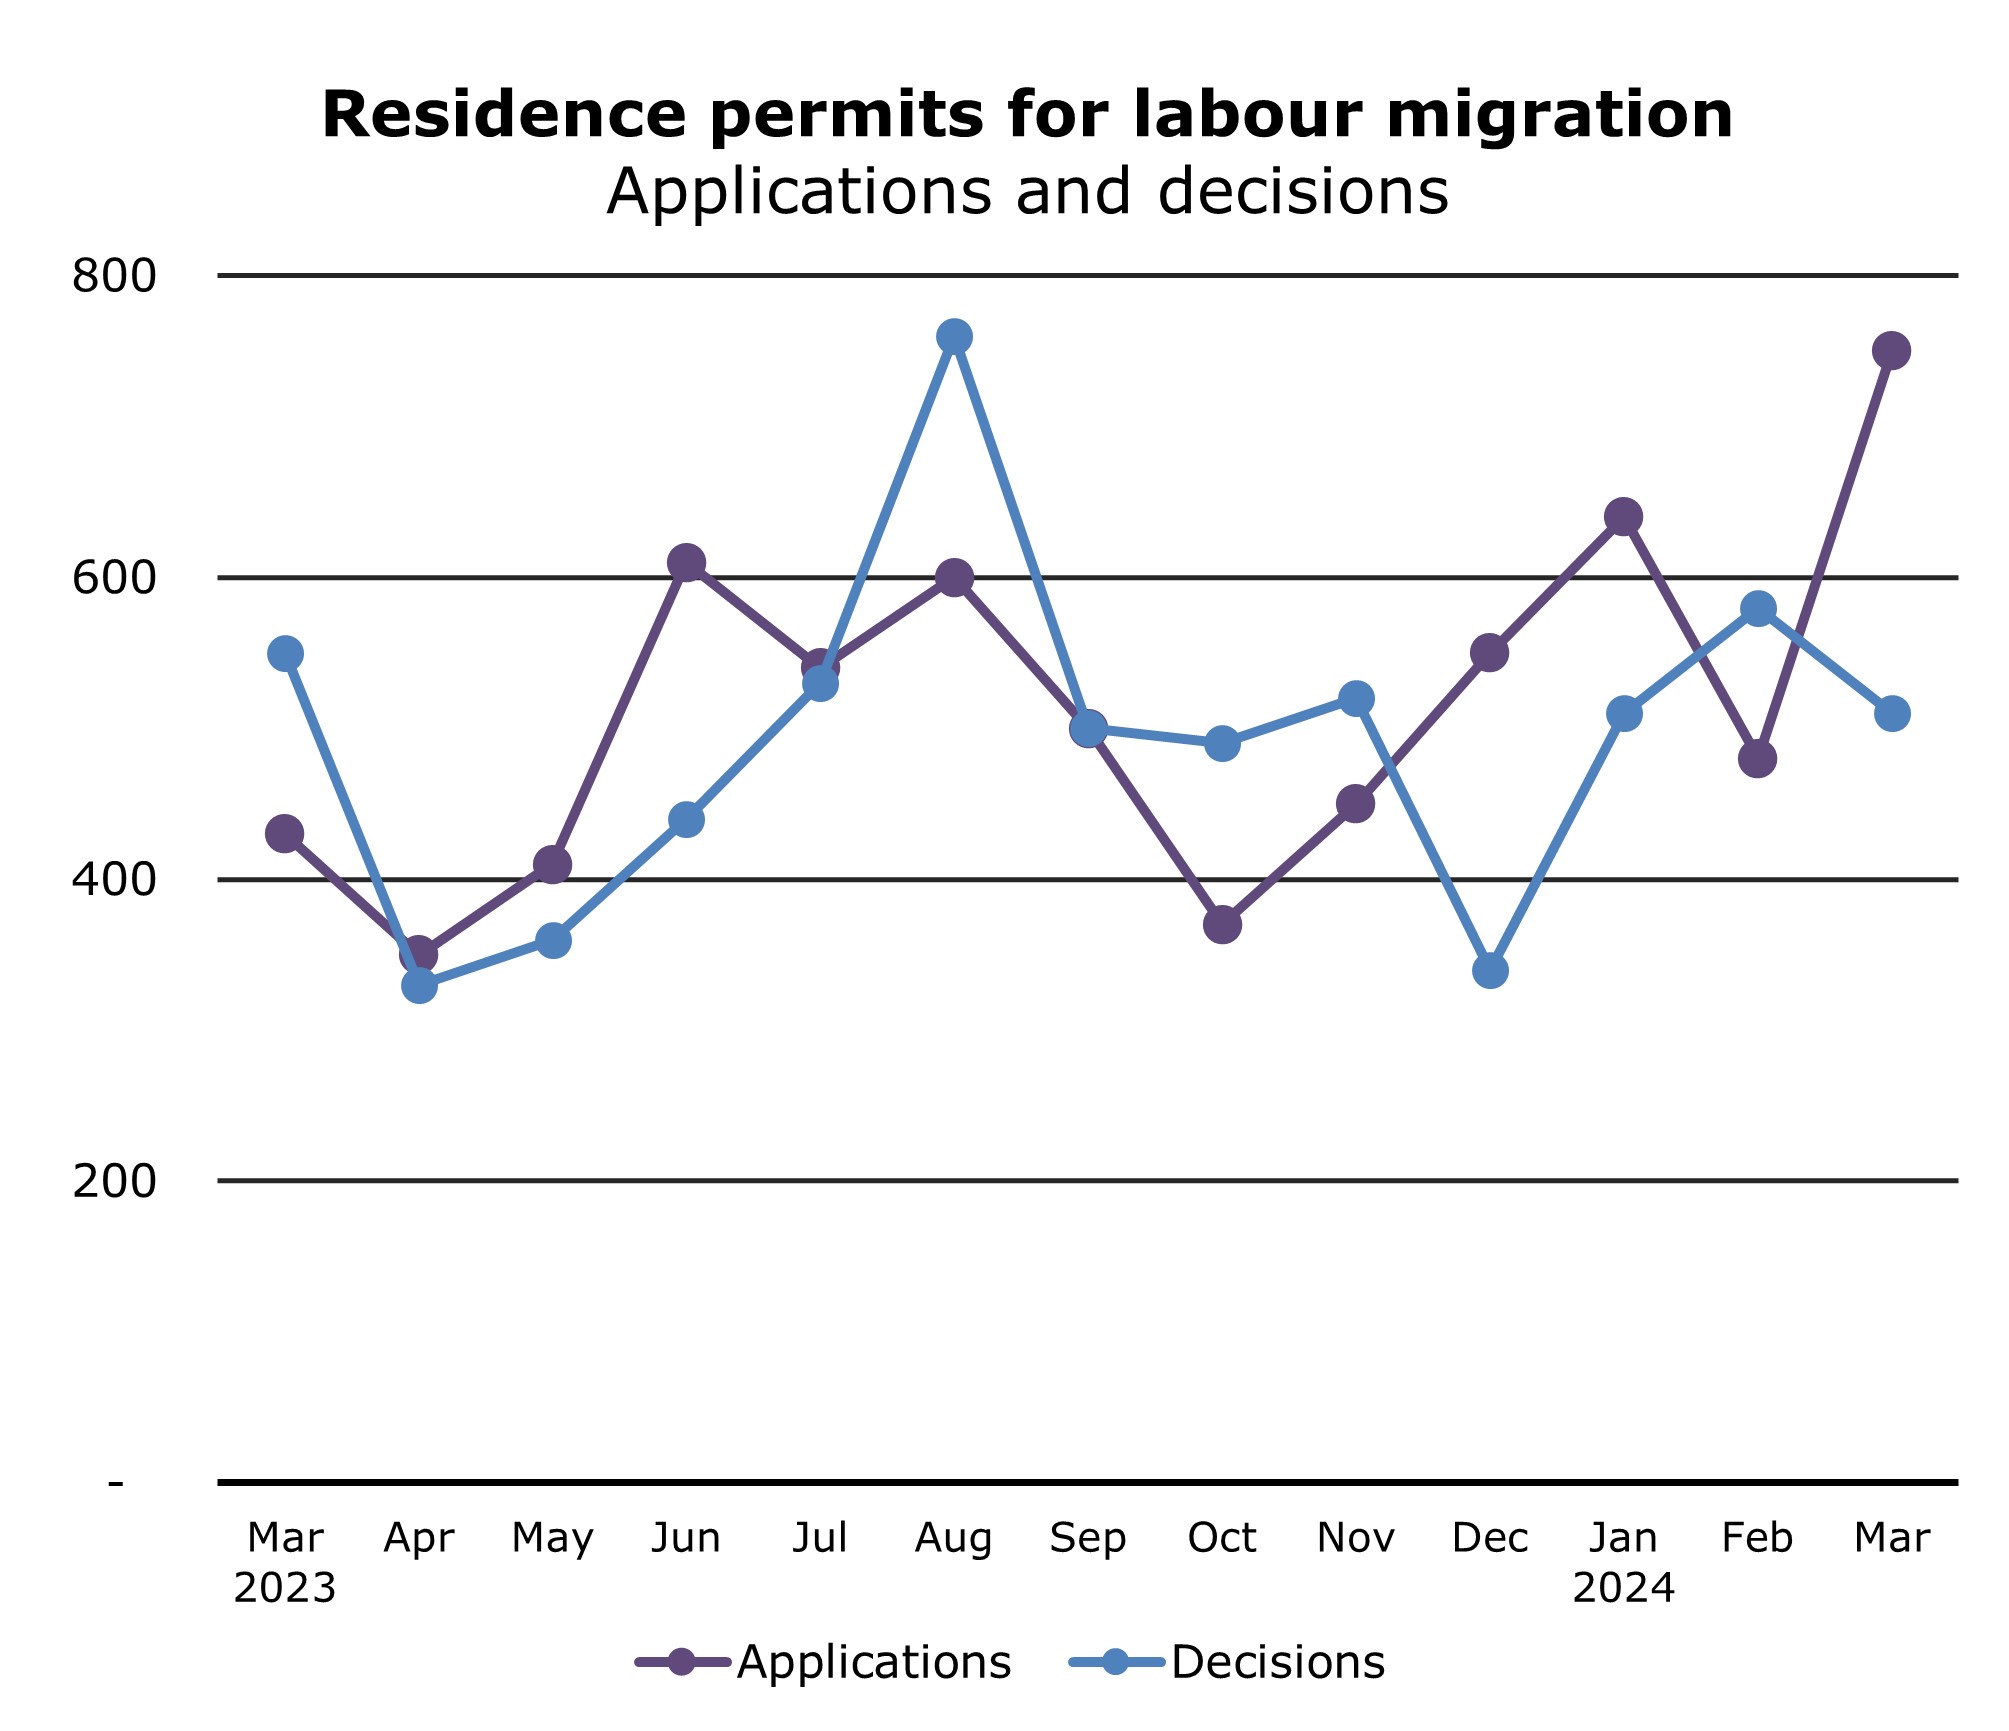
Migrant workers
 |
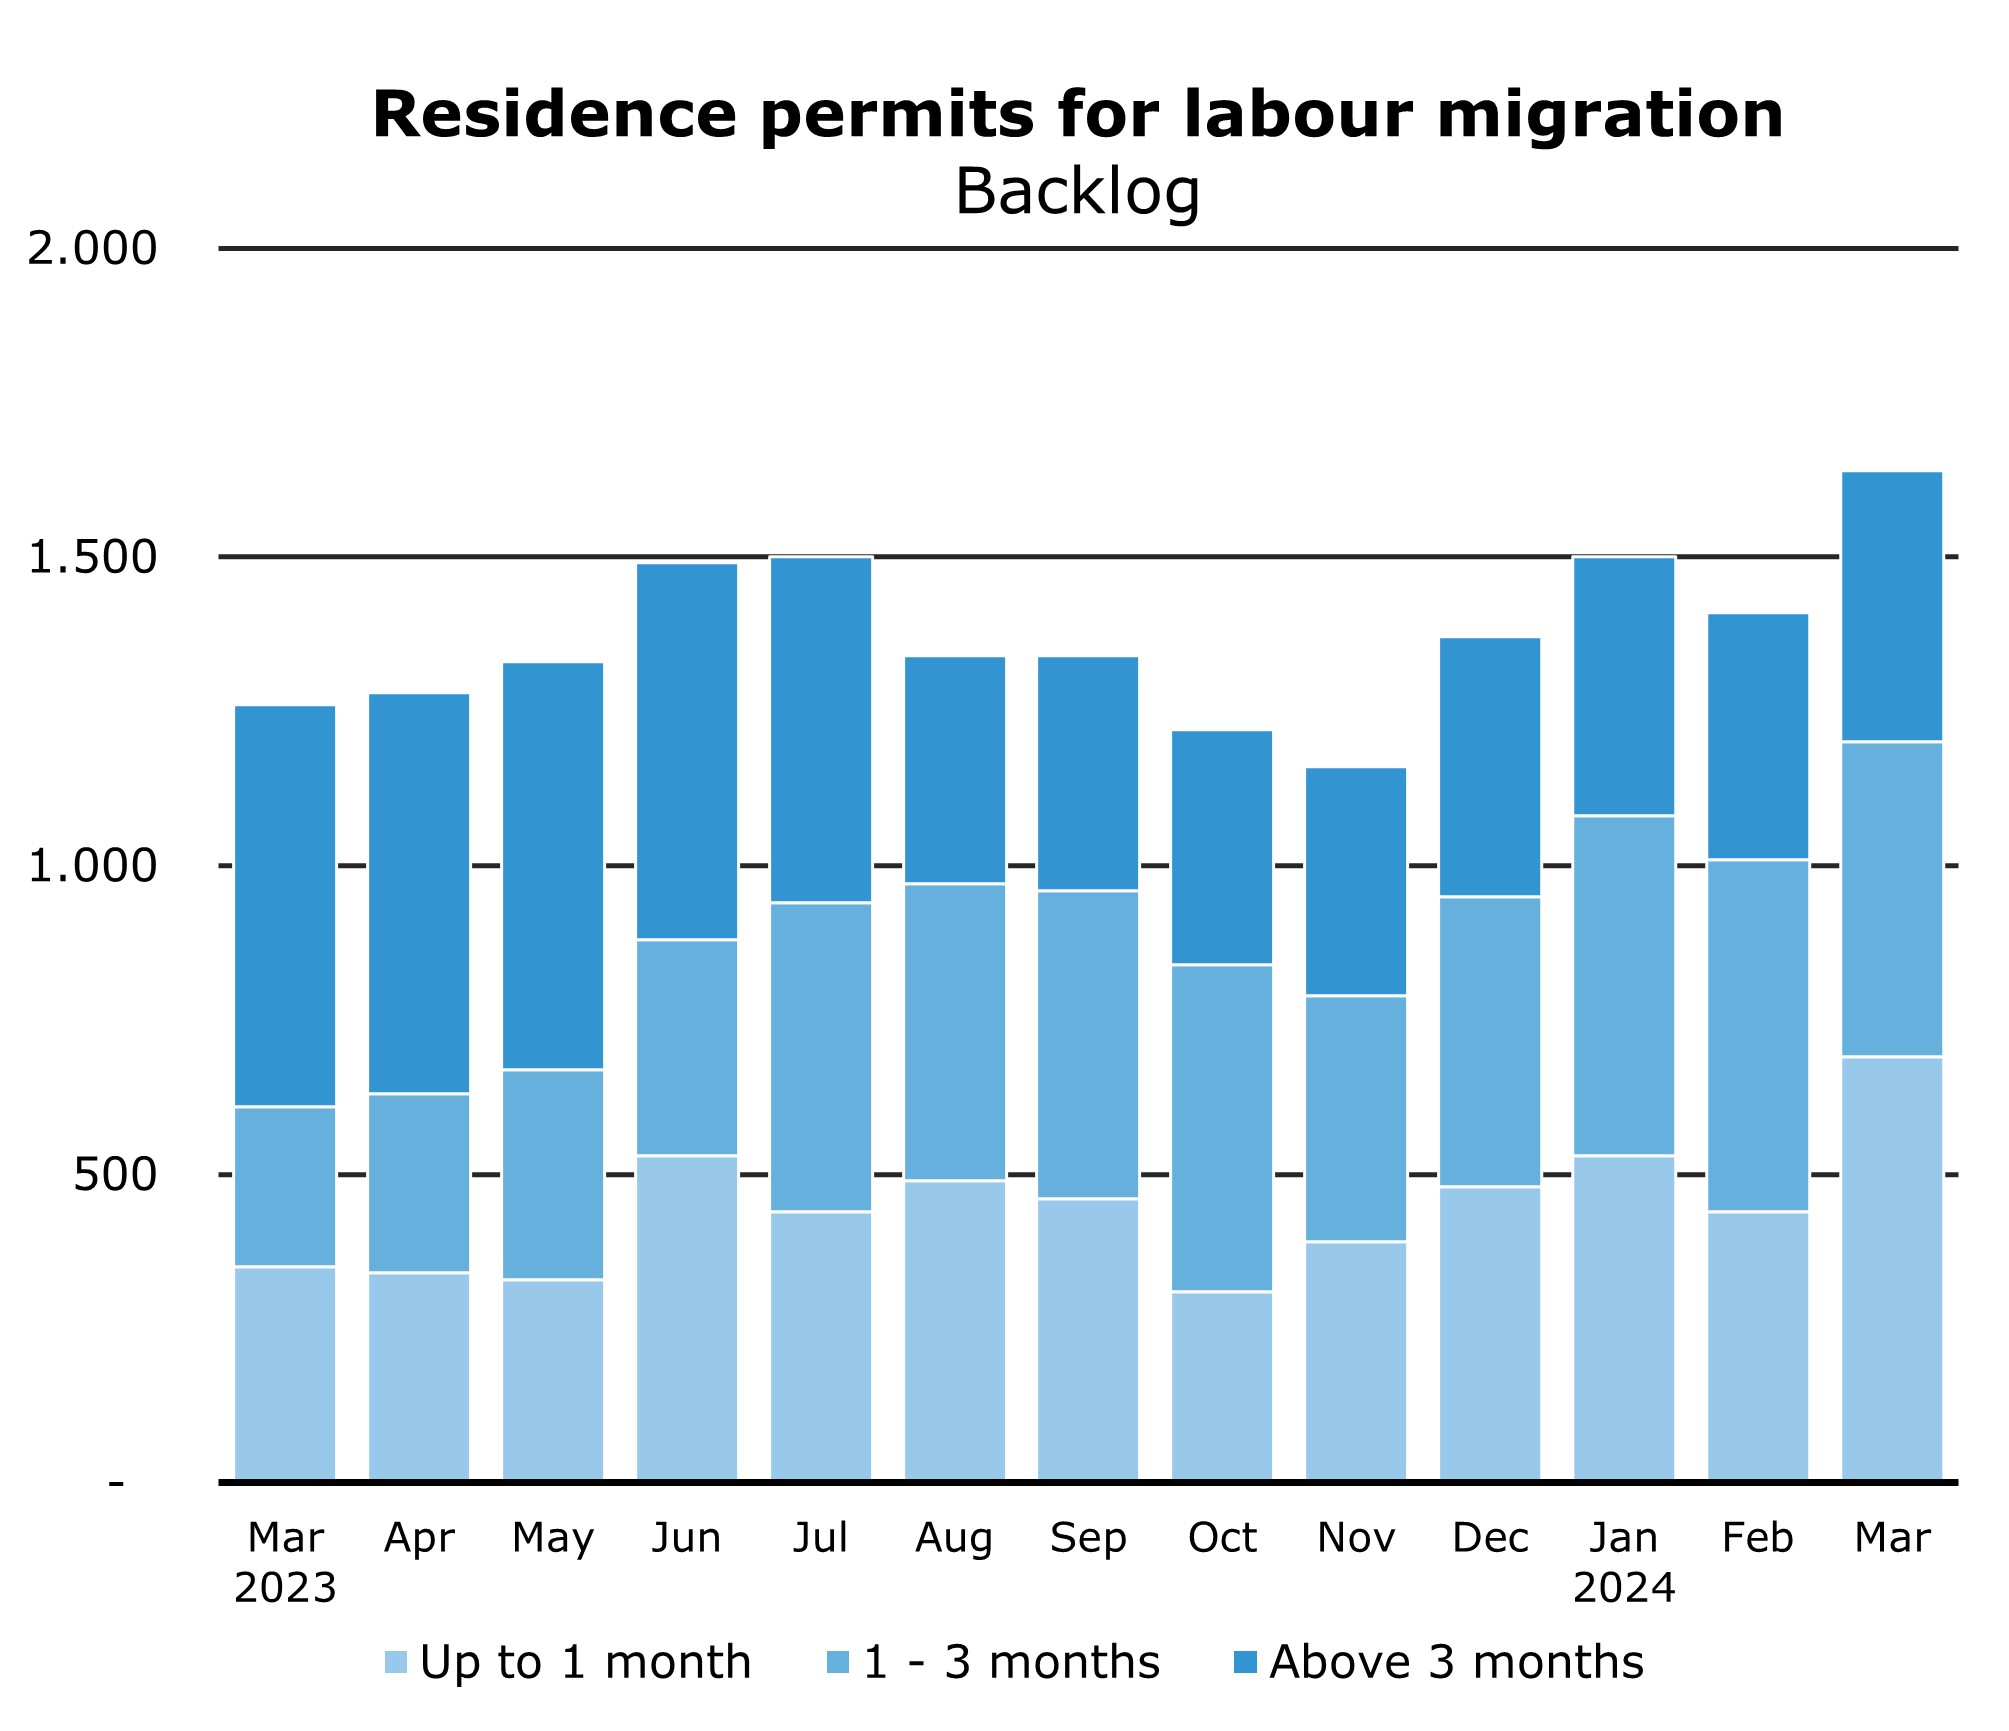 |
In March more labour migrants submitted applications. This number went from 480 to 750. The number of outstanding applications rose from 1,400 to 1,640.
Naturalization
 |
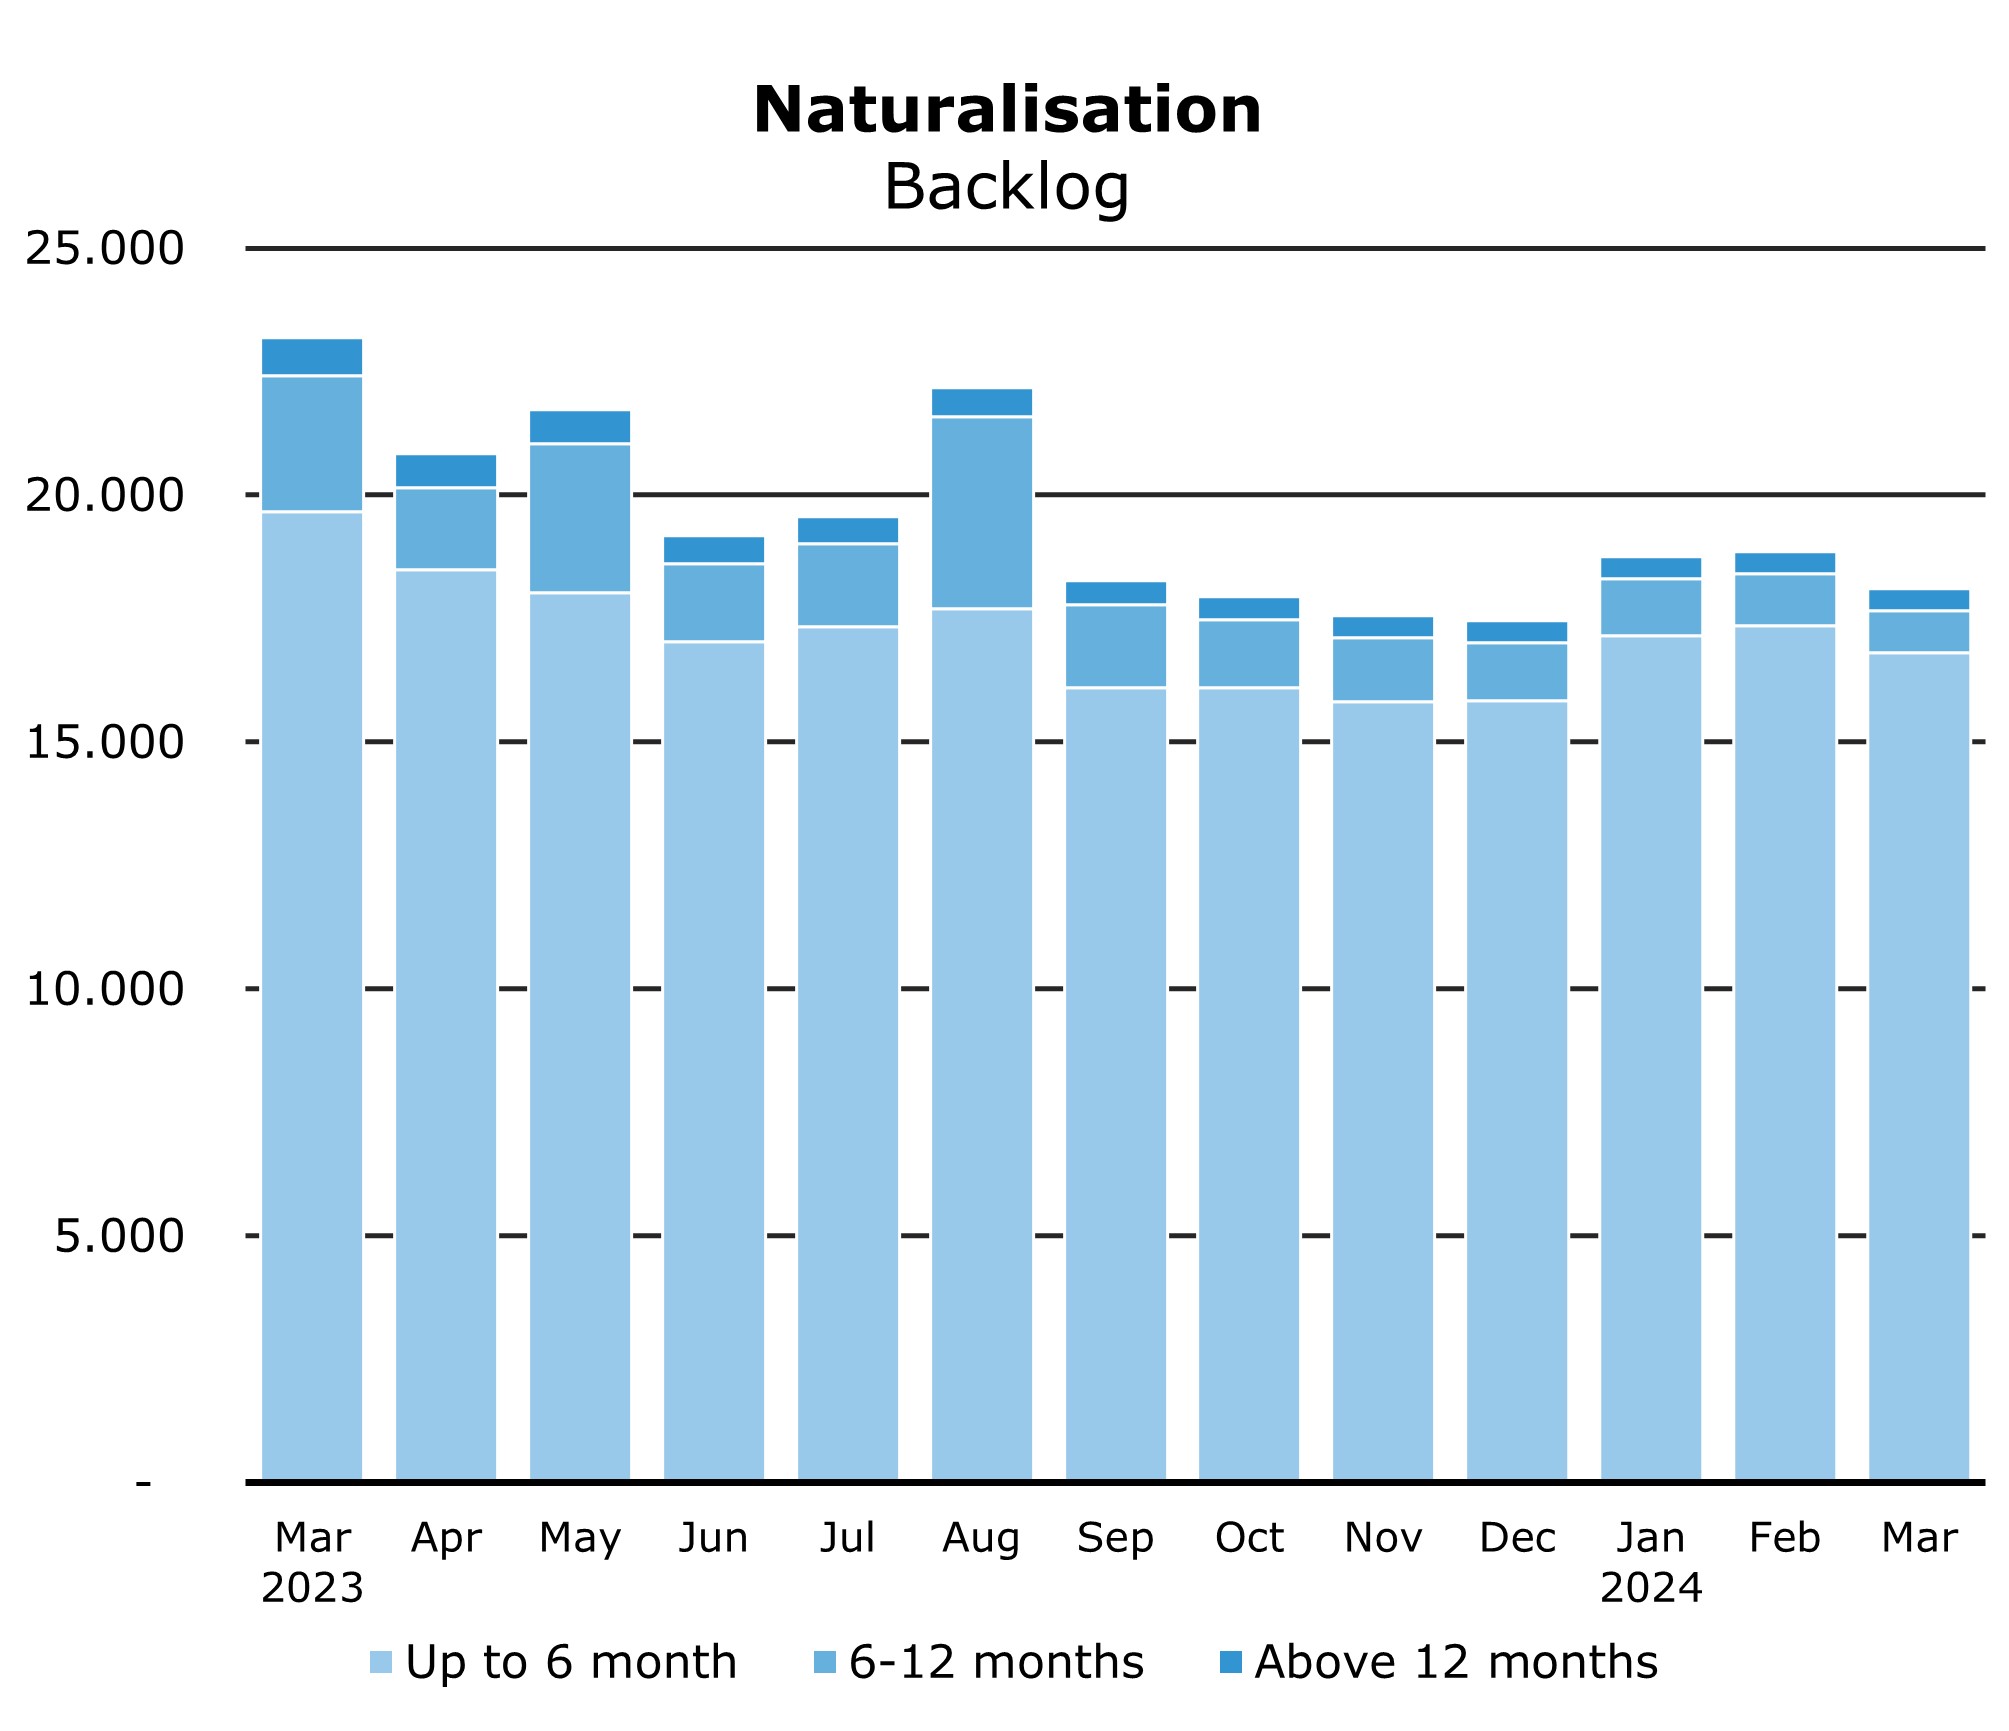 |
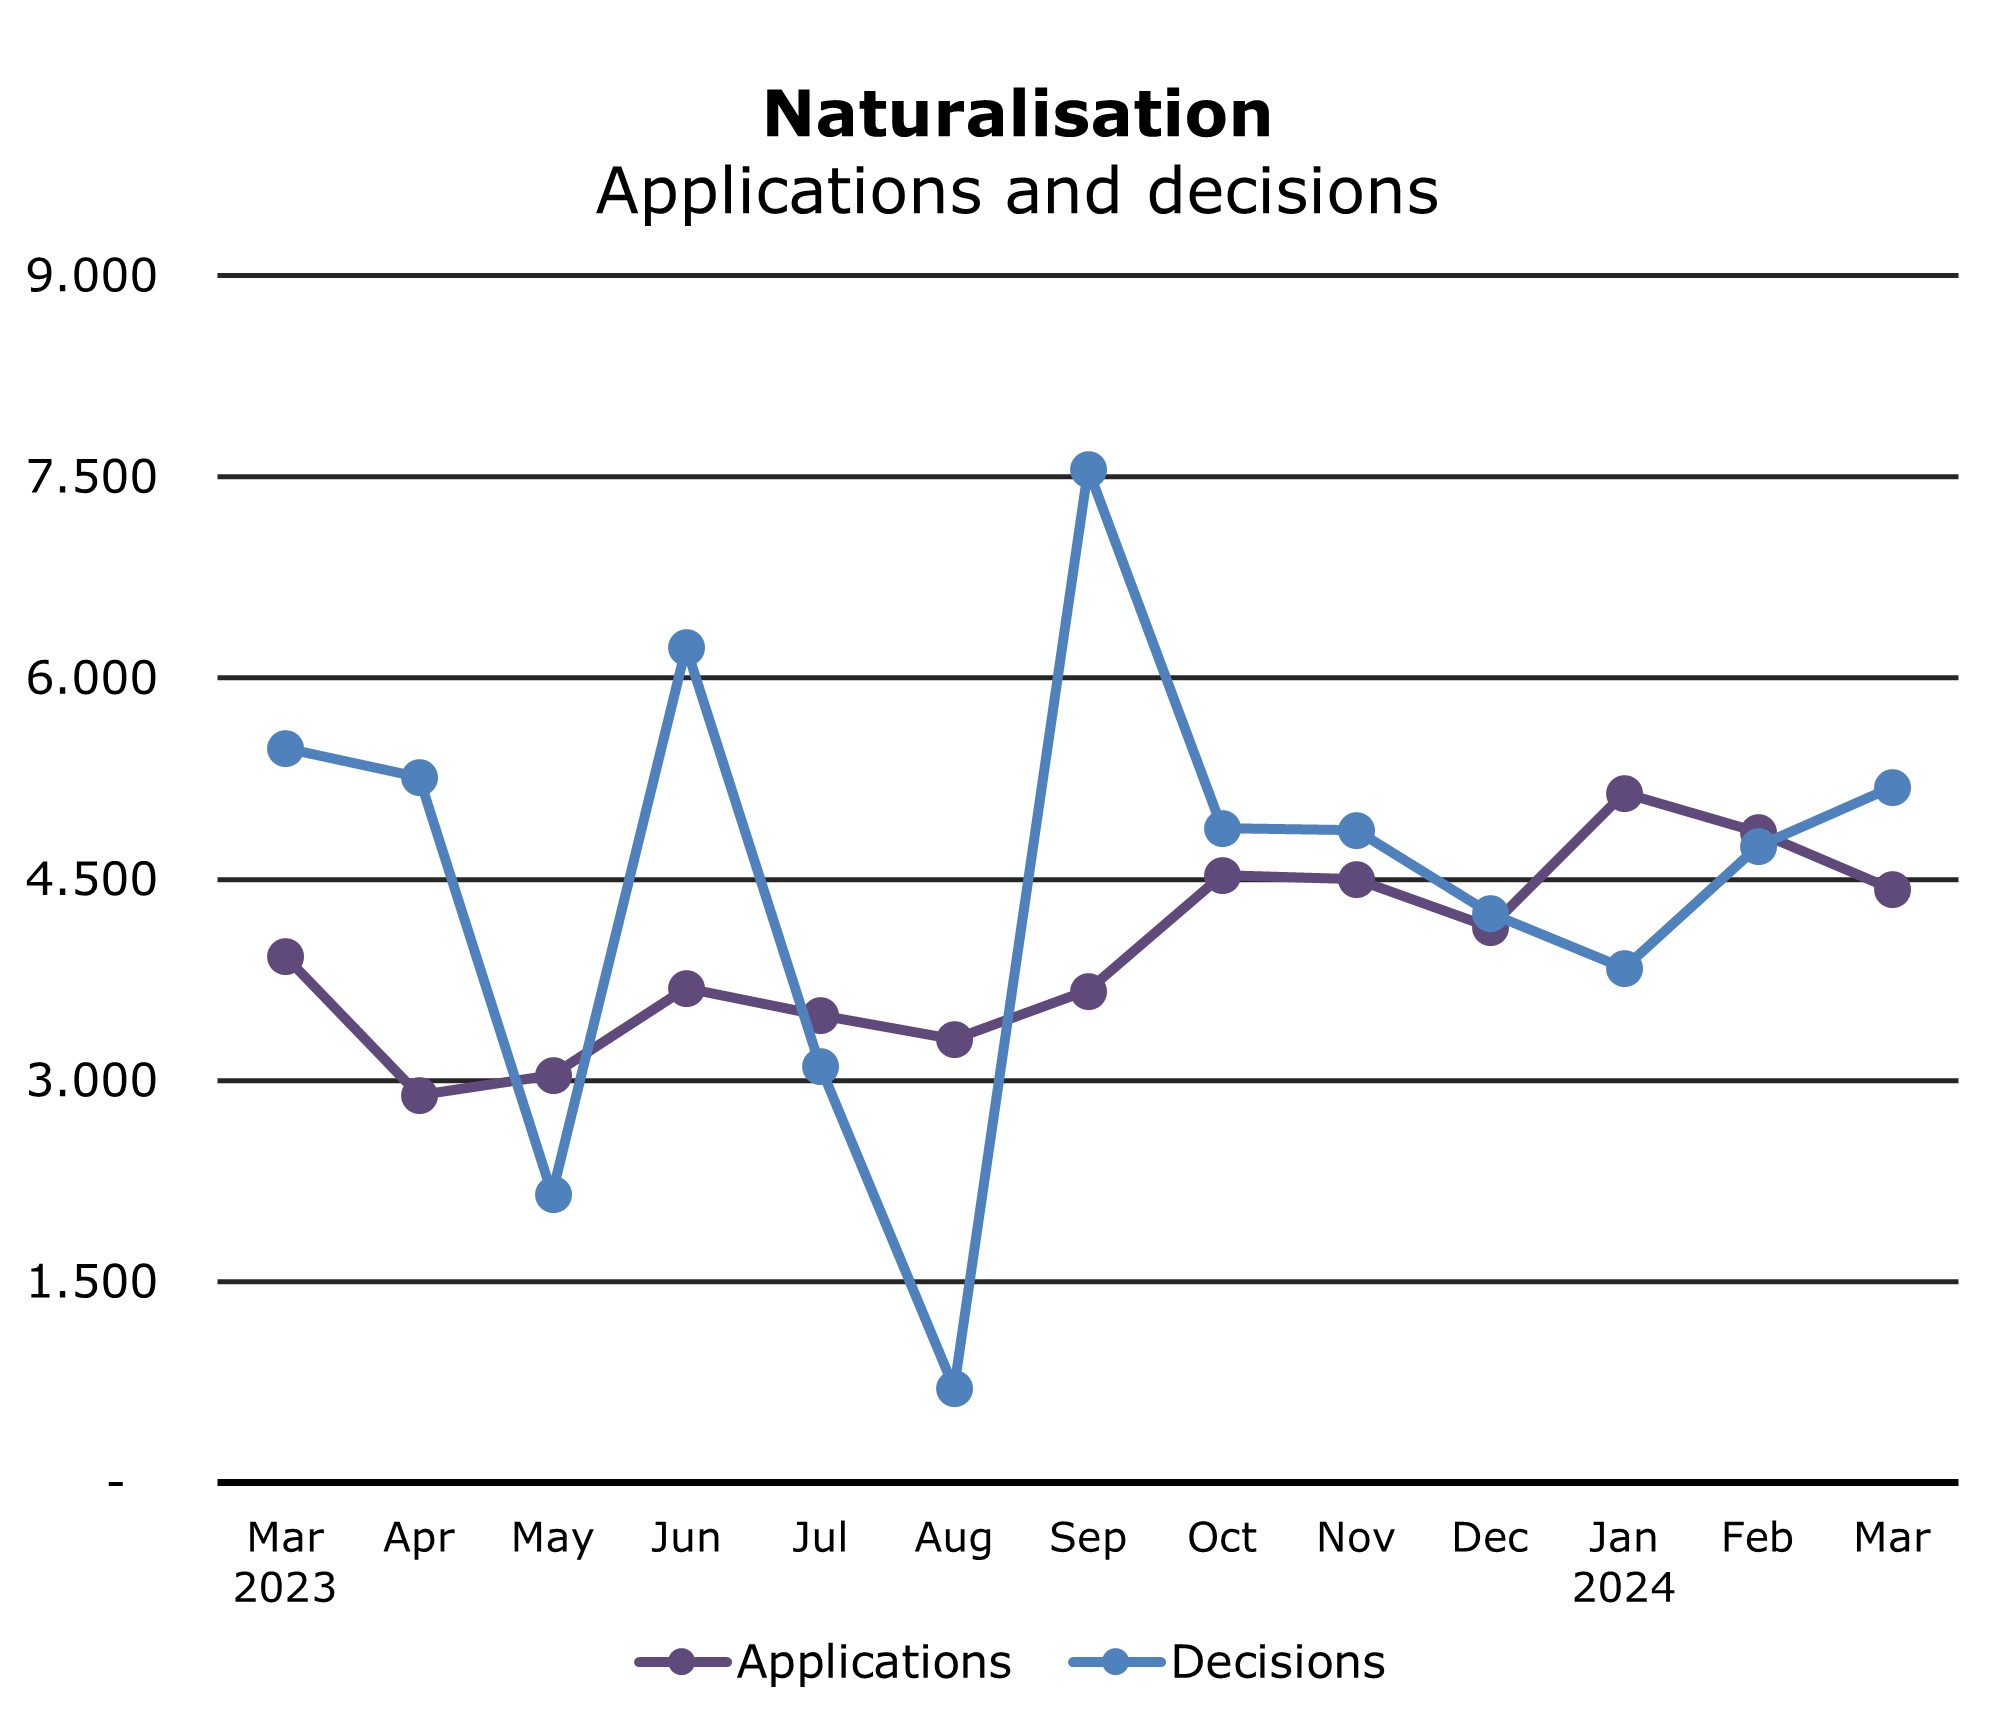
Somewhat fewer people submitted requests for naturalisation. This number decreased from 4,850 to 4,430. The number of decisions taken was 5,190, more than in February (4,750). The number of outstanding applications fell further from 18,860 to 18,100. In March last year these were 23,190. The naturalisation applications are submitted by municipalities, assessed by the IND and Netherlands nationality is ultimately granted by signing a Royal Decree.
Service desk
 |
 |
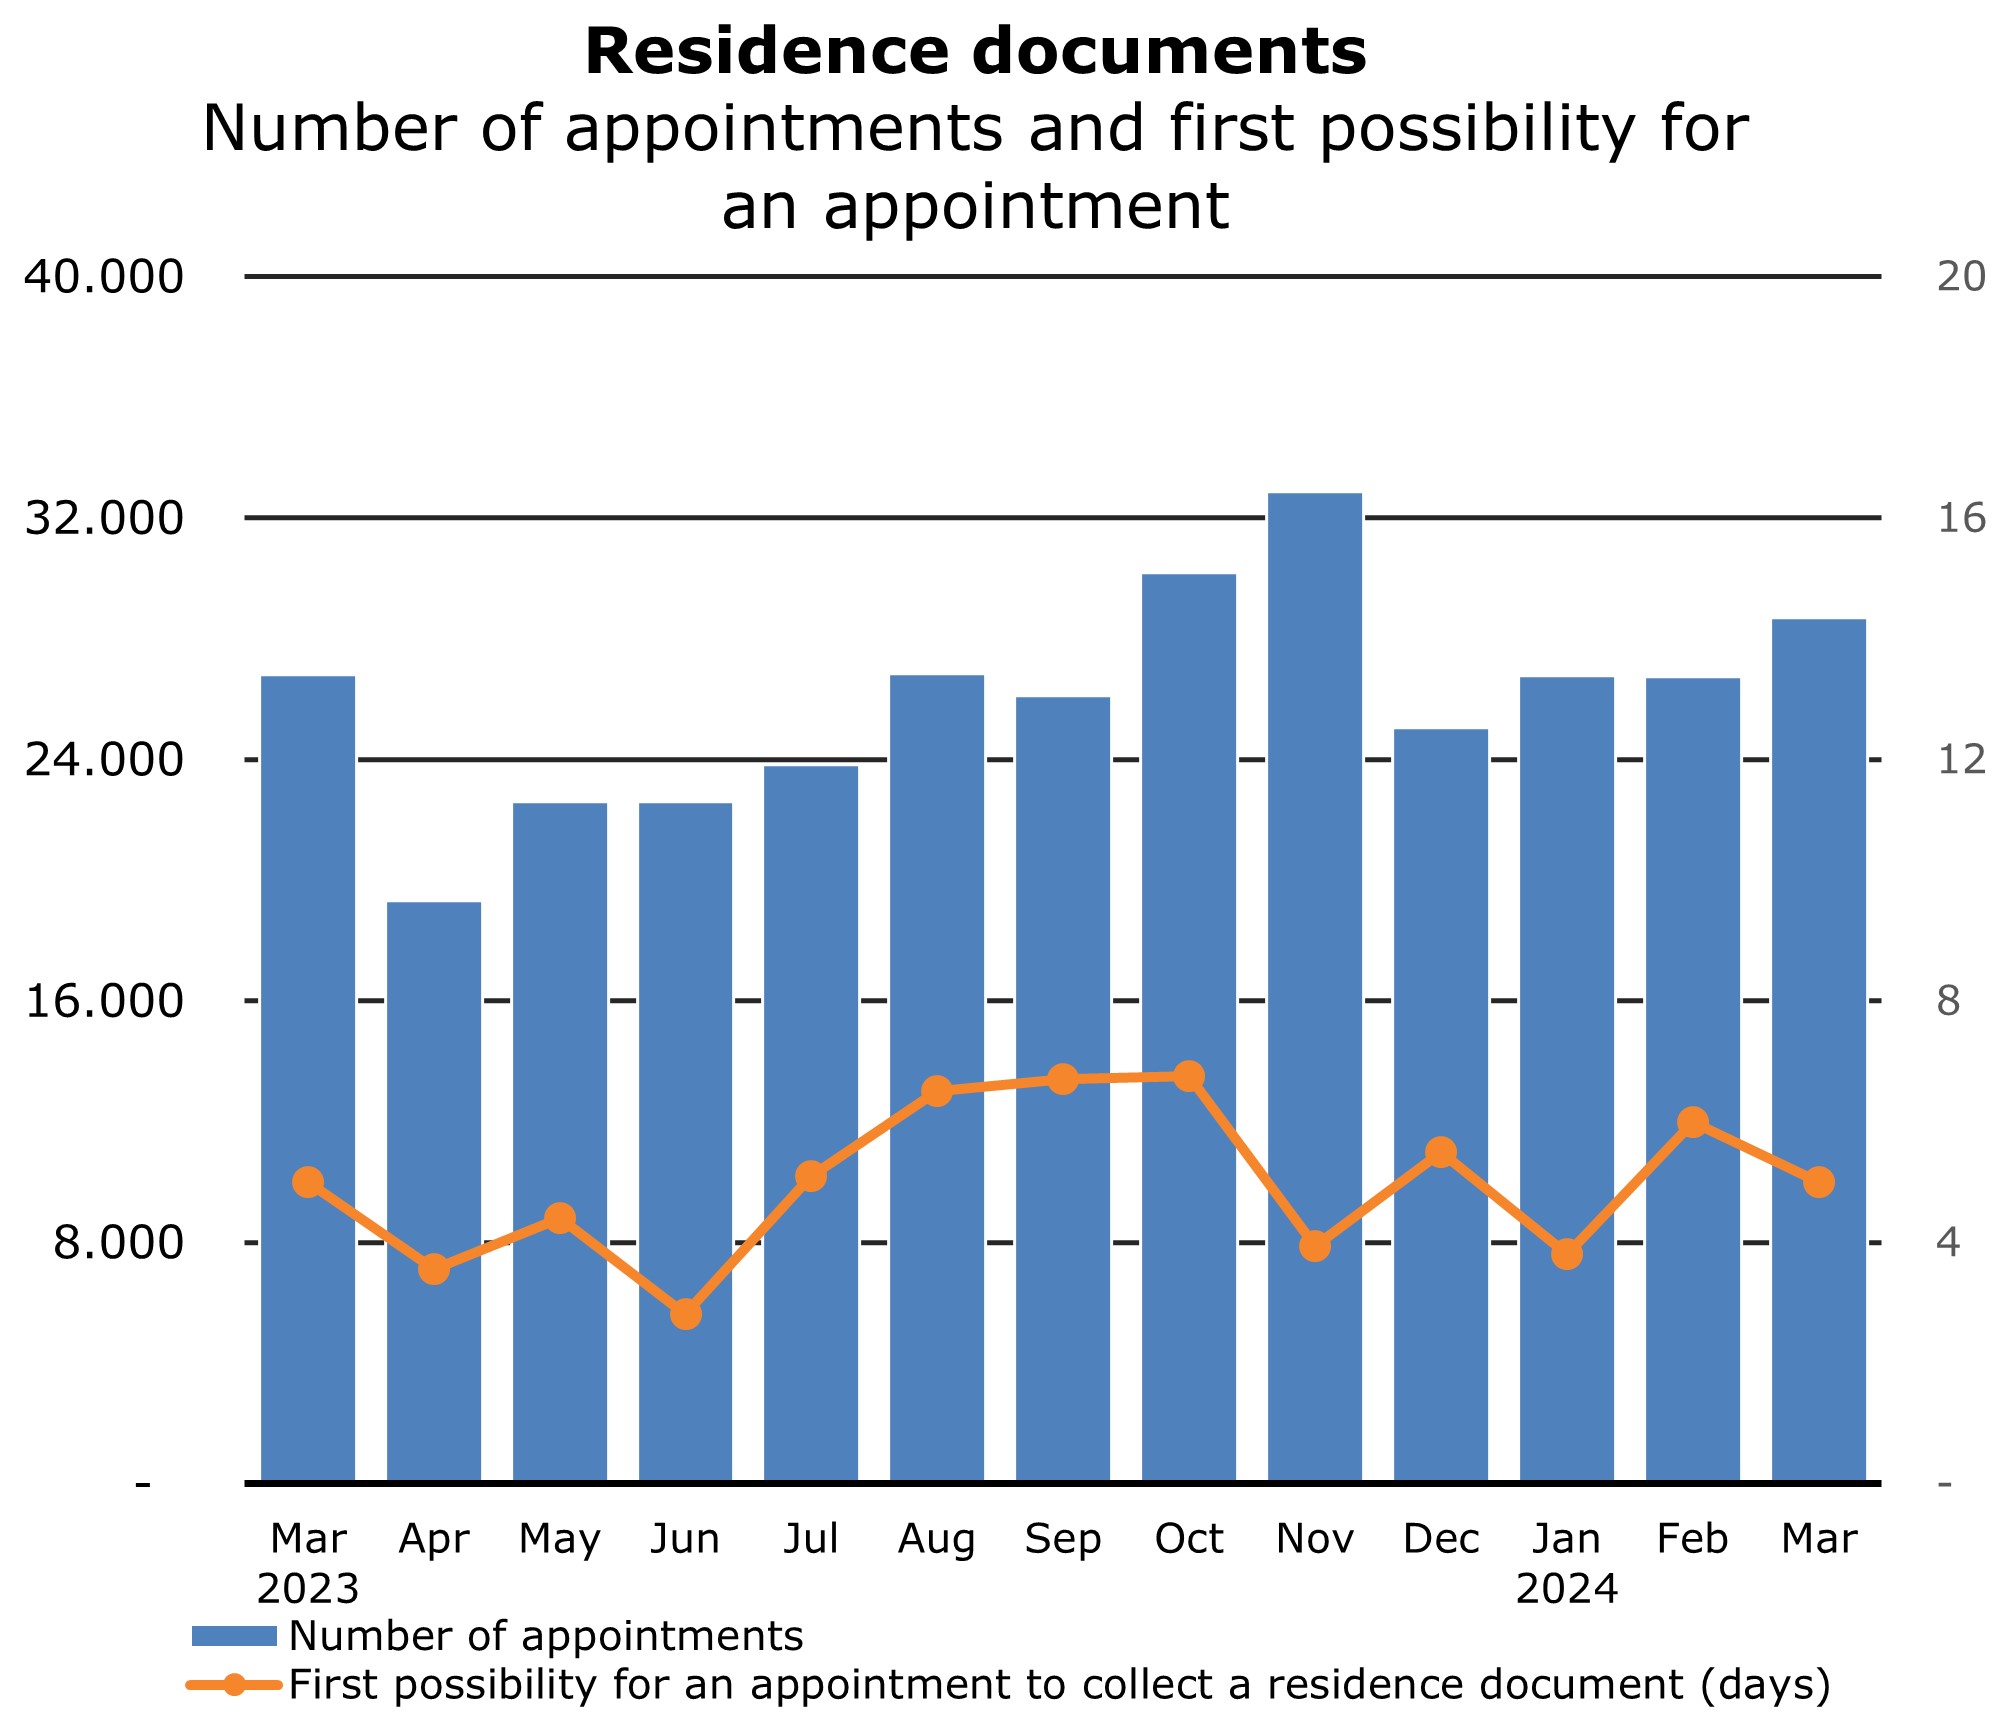
The IND issued almost 2,000 more documents in March than in February. The total ended up at 28,690. The first appointment possibility to pick up the residence permit was in March after 5 days. That is a day earlier than last month.
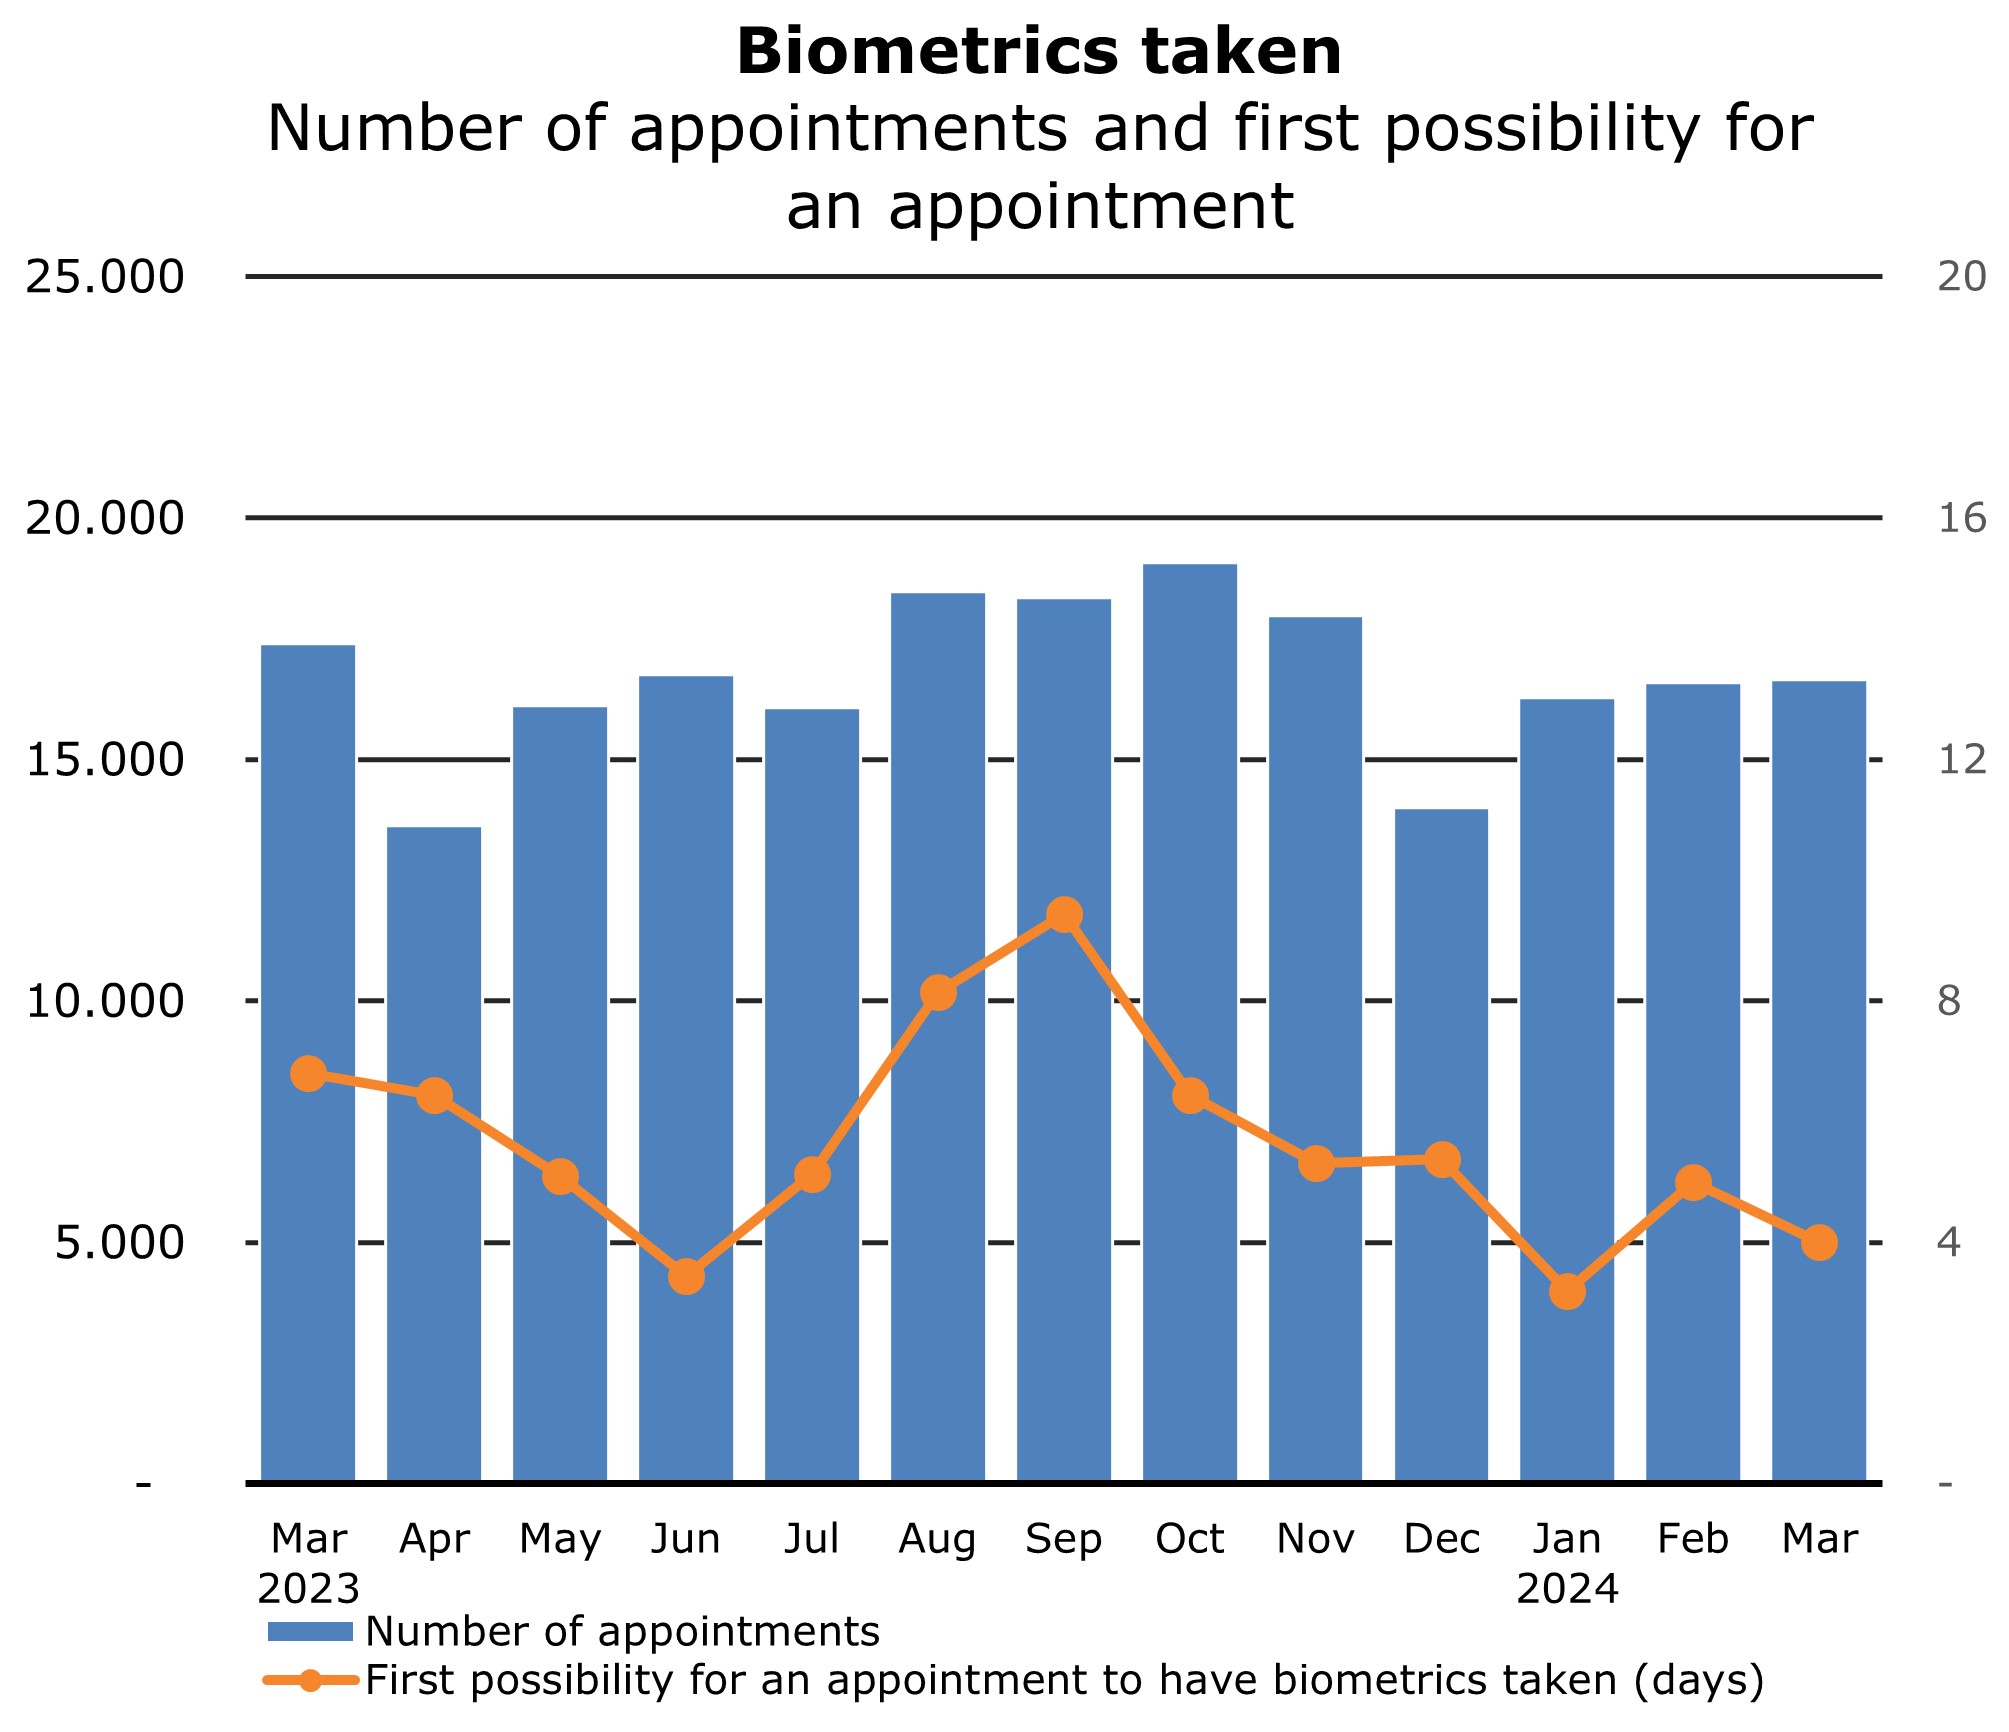
There were somewhat fewer appointments this month for taking biometrics (fingerprints and photo). The first appointment possibility for this was after 4 days.
* Where the graph shows 'Budget IND', this is ann average budget for the entire year (12 months)